

Question: questions 4, 5 and 6 Using these data: A statistics professor conducts a study to investigate the relationship between the performance of his students on
questions 4, 5 and 6
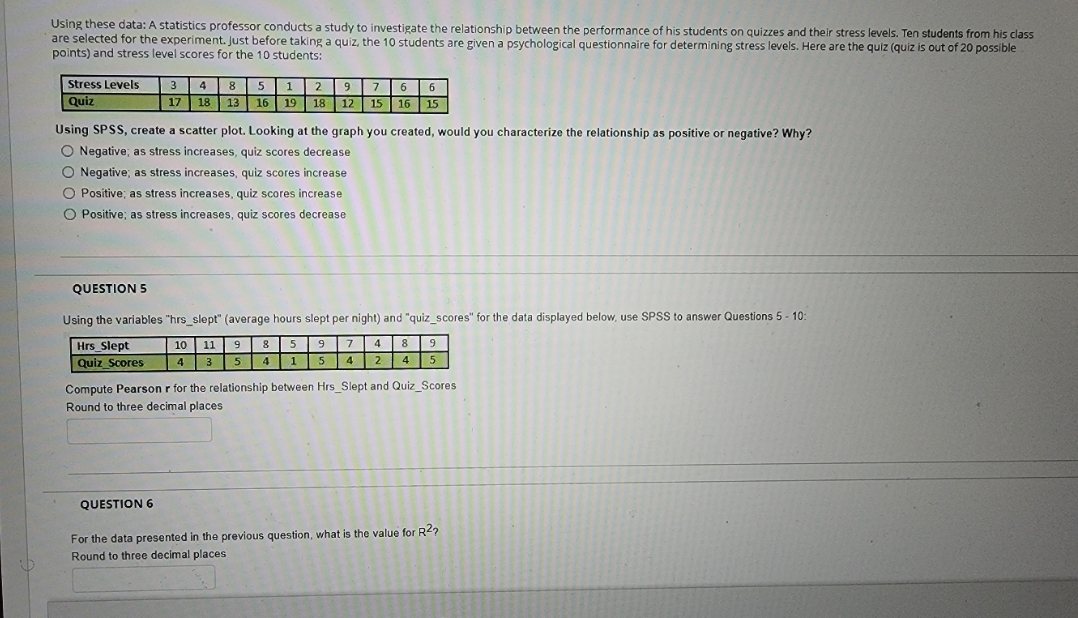
Using these data: A statistics professor conducts a study to investigate the relationship between the performance of his students on quizzes and their stress levels. Ten students from his class are selected for the experiment. Just before taking a quiz, the 10 students are given a psychological questionnaire for determining stress levels. Here are the quiz (quiz is out of 20 possible points) and stress level scores for the 10 students: Stress Levels 3 4 8 5 2 9 7 6 6 Quiz 18 13 16 19 18 12 15 16 15 Using SPSS, create a scatter plot. Looking at the graph you created, would you characterize the relationship as positive or negative? Why? O Negative; as stress increases, quiz scores decrease O Negative; as stress increases, quiz scores increase O Positive; as stress increases, quiz scores increase O Positive; as stress increases, quiz scores decrease QUESTION 5 Using the variables "hrs_slept" (average hours slept per night) and "quiz_scores" for the data displayed below, use SPSS to answer Questions 5 - 10: Hrs_Slept 10 11 9 8 5 9 8 9 Quiz Scores 4 3 5 5 5 Compute Pearson r for the relationship between Hrs_Slept and Quiz_Scores Round to three decimal places QUESTION 6 For the data presented in the previous question, what is the value for R27 Round to three decimal places
Step by Step Solution
There are 3 Steps involved in it

Get step-by-step solutions from verified subject matter experts