

Question: Questions 4 and 5 are based on ASU enrollment data from 2015 through 2018 as shown below: Year 2015 2016 2017 2018 # Students Enrolled
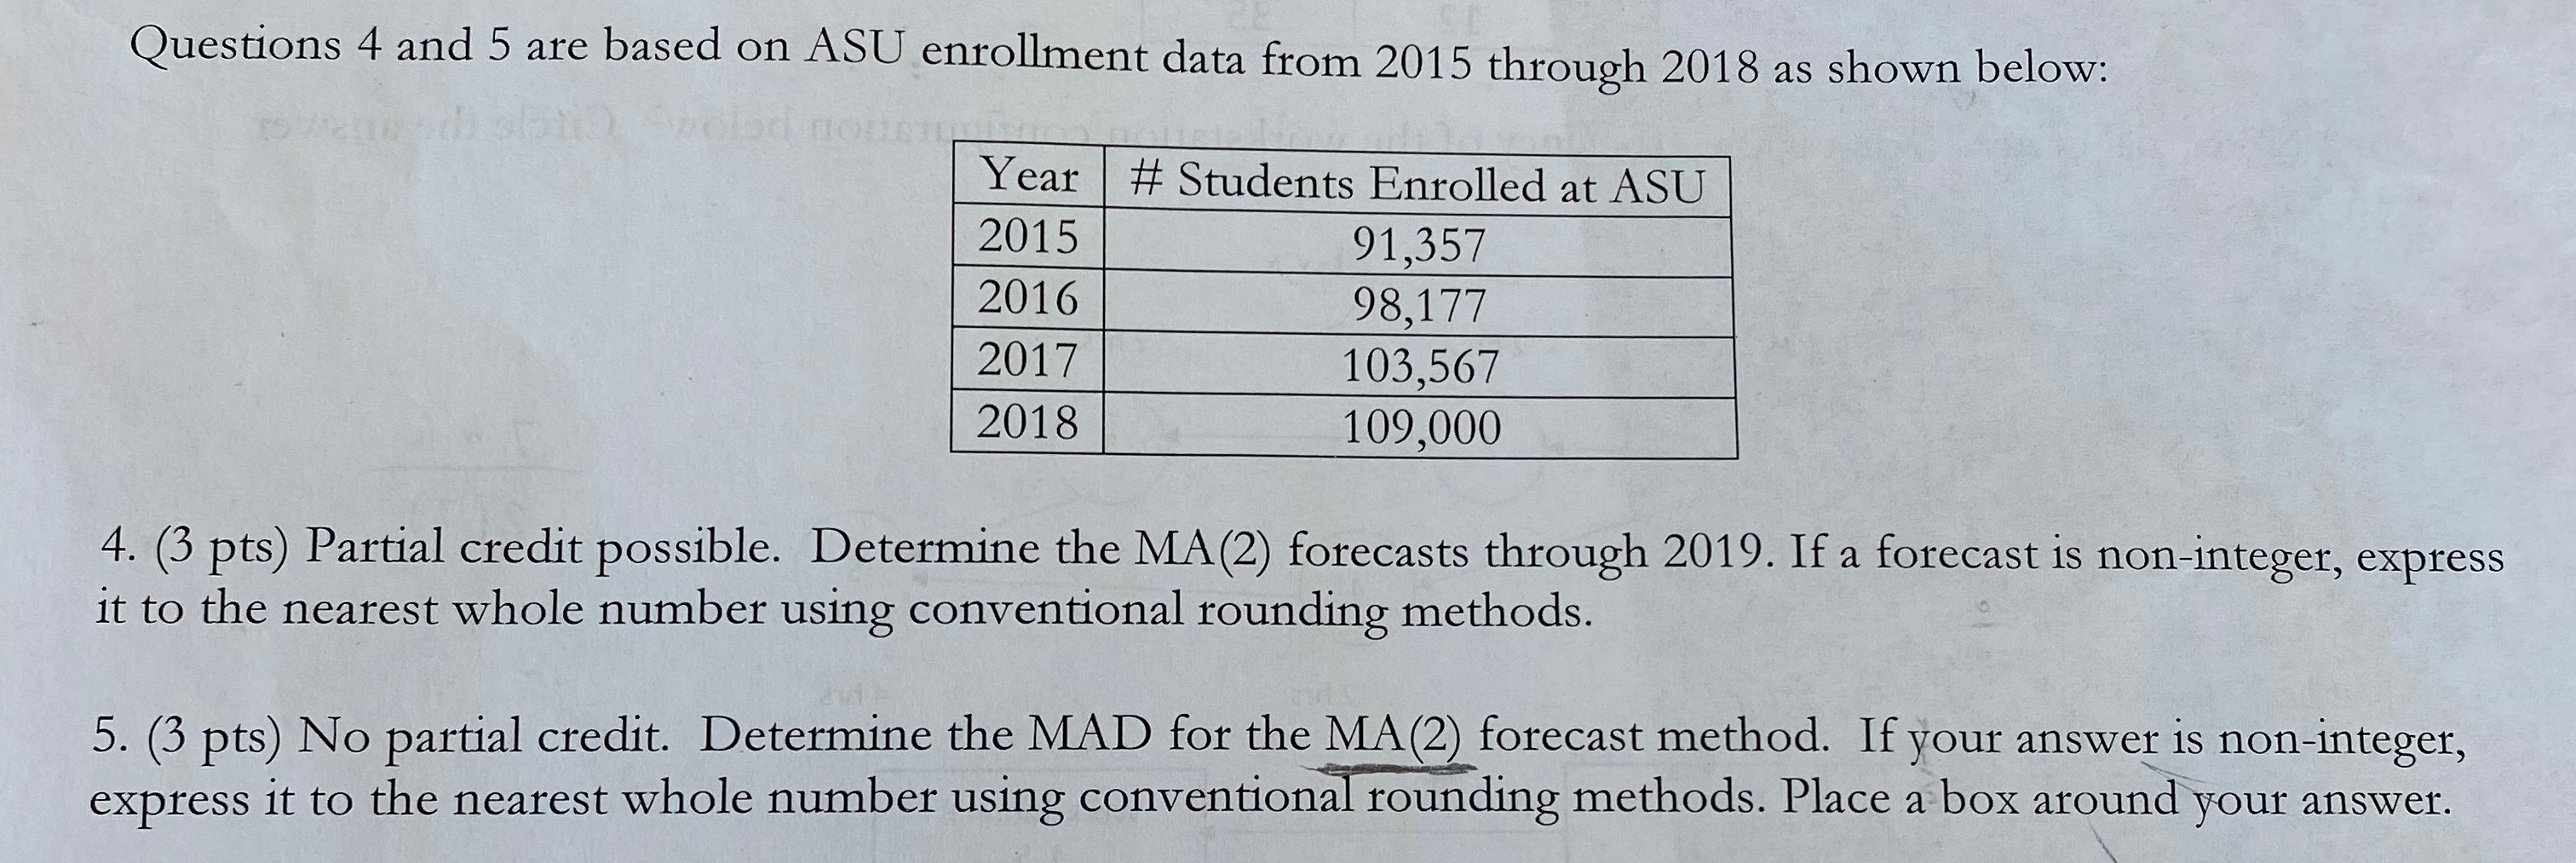
Questions 4 and 5 are based on ASU enrollment data from 2015 through 2018 as shown below: Year 2015 2016 2017 2018 # Students Enrolled at ASU 91,357 98,177 103,567 109,000 4. (3 pts) Partial credit possible. Determine the MA(2) forecasts through 2019. If a forecast is non-integer, express it to the nearest whole number using conventional rounding methods. 5. (3 pts) No partial credit. Determine the MAD for the MA(2) forecast method. If your answer is non-integer, express it to the nearest whole number using conventional rounding methods. Place a box around your answer. Questions 4 and 5 are based on ASU enrollment data from 2015 through 2018 as shown below: Year 2015 2016 2017 2018 # Students Enrolled at ASU 91,357 98,177 103,567 109,000 4. (3 pts) Partial credit possible. Determine the MA(2) forecasts through 2019. If a forecast is non-integer, express it to the nearest whole number using conventional rounding methods. 5. (3 pts) No partial credit. Determine the MAD for the MA(2) forecast method. If your answer is non-integer, express it to the nearest whole number using conventional rounding methods. Place a box around your
Step by Step Solution
There are 3 Steps involved in it

Get step-by-step solutions from verified subject matter experts