

Question: Questions 7- 11 . A Scatterplot below was made using the annual [FI rate from 1950 to 2014 . A trend line was added .
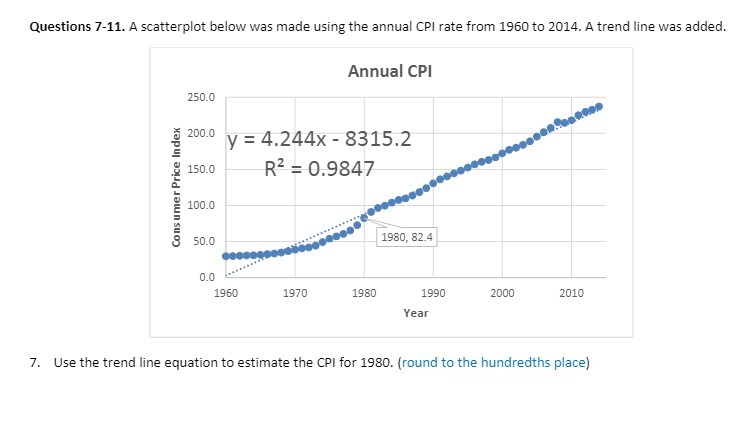
Questions 7- 11 . A Scatterplot below was made using the annual [FI rate from 1950 to 2014 . A trend line was added . Annual CPI 250.0 20:0.0 V = 4. 24 4 x - 8315. 2 150.0 R 2 = 0. 9847 Consumer Price Index 100. 0 50.0 1980, 32. 4 19 ED 1970 1980 1950 20:00 2010 Year 7. USE the trend line Equation to estimate the [FI for 1980 . ( round to the hundredths place )
Step by Step Solution
There are 3 Steps involved in it
1 Expert Approved Answer
Step: 1 Unlock

Question Has Been Solved by an Expert!
Get step-by-step solutions from verified subject matter experts
Step: 2 Unlock
Step: 3 Unlock