

Question: Questions: a ) Using MS Excel, create a scatter plot with cholesterol saturation index values ( CSI ) on the x - axis and nucleation
Questions:
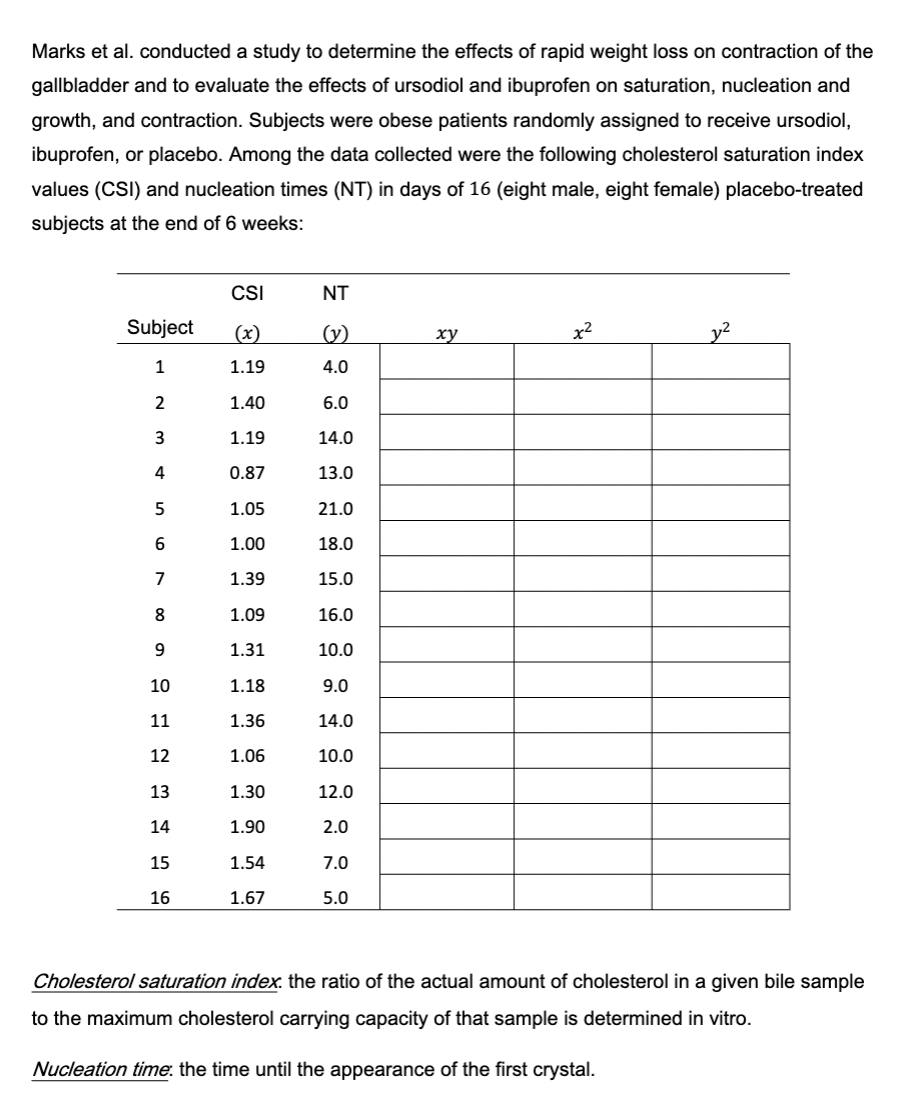
a Using MS Excel, create a scatter plot with cholesterol saturation index values CSI on
the x axis and nucleation times NT on the y axis. Point
b Summarize the plot. Points
c Calculate the mean value for the CSIxround to decimal place Show your work.
Points
d Calculate the mean value for NT yround to decimal place Show your work.
Points
e Complete the table above and compute the following:
I. Calculate the sum of xy round to decimal place point
II Calculate the Sum of xround to decimal place point
III. Calculate the sum of yround to decimal place point
f Calculate the correlation coefficient round to decimal place Show your work.
Points
g Summarize the strength of the relationship between CSI and NT Point
h State the null and alternative hypothesis. Point
i Calculate ttest statistic for the correlation round to decimal place Show your work.
Points
j Find the degrees of freedom. Show your work. point
k Let alpha find the critical value round to decimal place and state your
conclusion. Point
I Let alpha find the pvalue round to decimal place and state your conclusion.
Point
Step by Step Solution
There are 3 Steps involved in it
1 Expert Approved Answer
Step: 1 Unlock

Question Has Been Solved by an Expert!
Get step-by-step solutions from verified subject matter experts
Step: 2 Unlock
Step: 3 Unlock