

Question: Questions are based on the table below. Q2 Year Q1 P 2012 50 $20 10 2016 100 $10 5 Table 2: GDP of Neverland
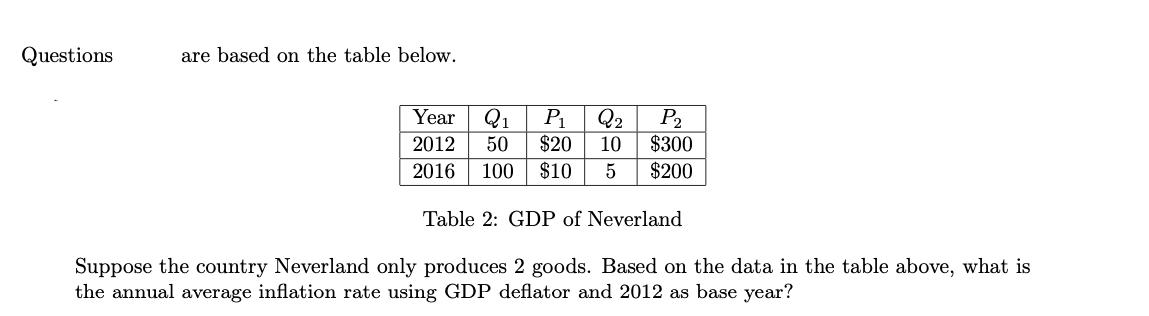
Questions are based on the table below. Q2 Year Q1 P 2012 50 $20 10 2016 100 $10 5 Table 2: GDP of Neverland Suppose the country Neverland only produces 2 goods. Based on the data in the table above, what is the annual average inflation rate using GDP deflator and 2012 as base year? P2 $300 $200
Step by Step Solution
★★★★★
3.42 Rating (155 Votes )
There are 3 Steps involved in it
1 Expert Approved Answer
Step: 1 Unlock

Calculate the annual average inflation rate using the GDP deflator and 2012 as the base year Ca... View full answer
Question Has Been Solved by an Expert!
Get step-by-step solutions from verified subject matter experts
Step: 2 Unlock
Step: 3 Unlock