

Question: questions are in documents 8)Use the regression model to predict the amount of algae coverage in square meters after 87 days. A.640.45m2 B.12,913.05m2 C.4,156.6m2 D.483.89m2
questions are in documents
8)Use the regression model to predict the amount of algae coverage in square meters after 87 days.
A.640.45m2
B.12,913.05m2
C.4,156.6m2
D.483.89m2
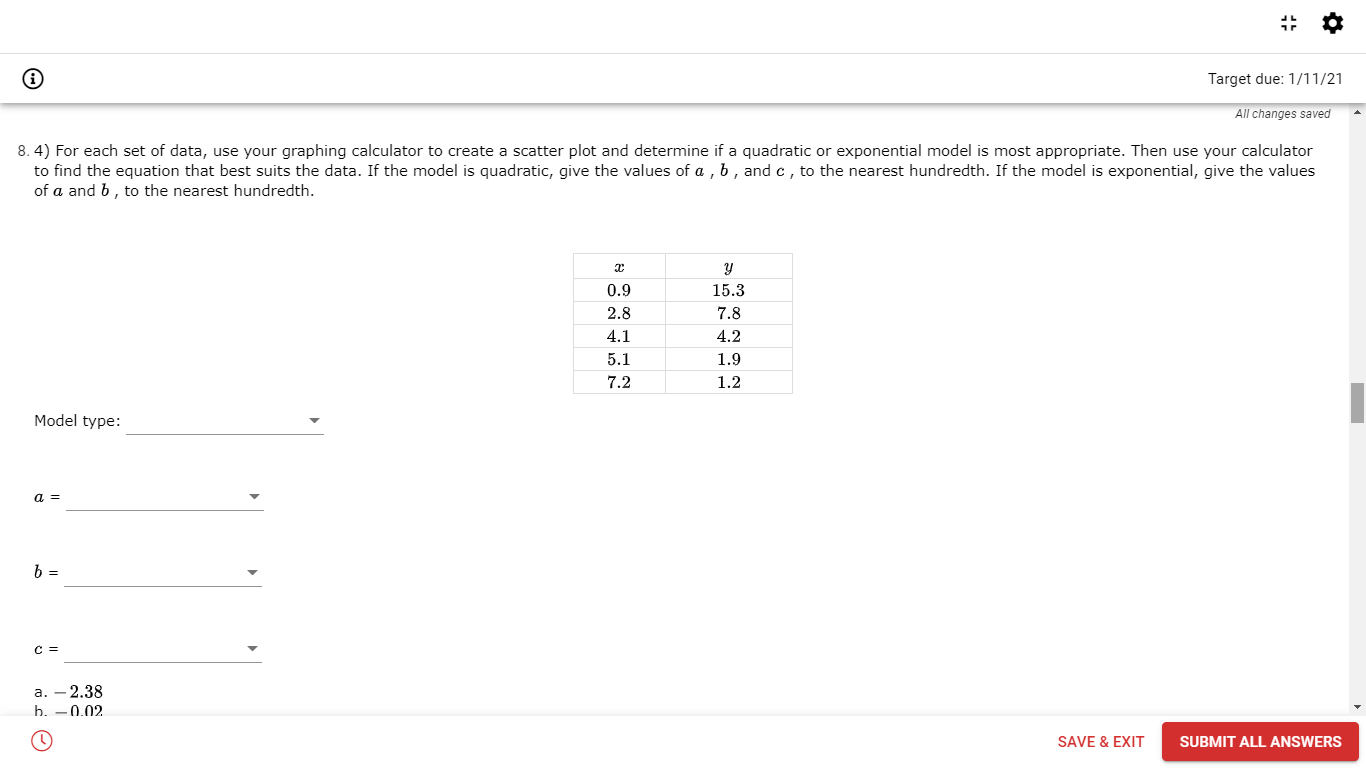
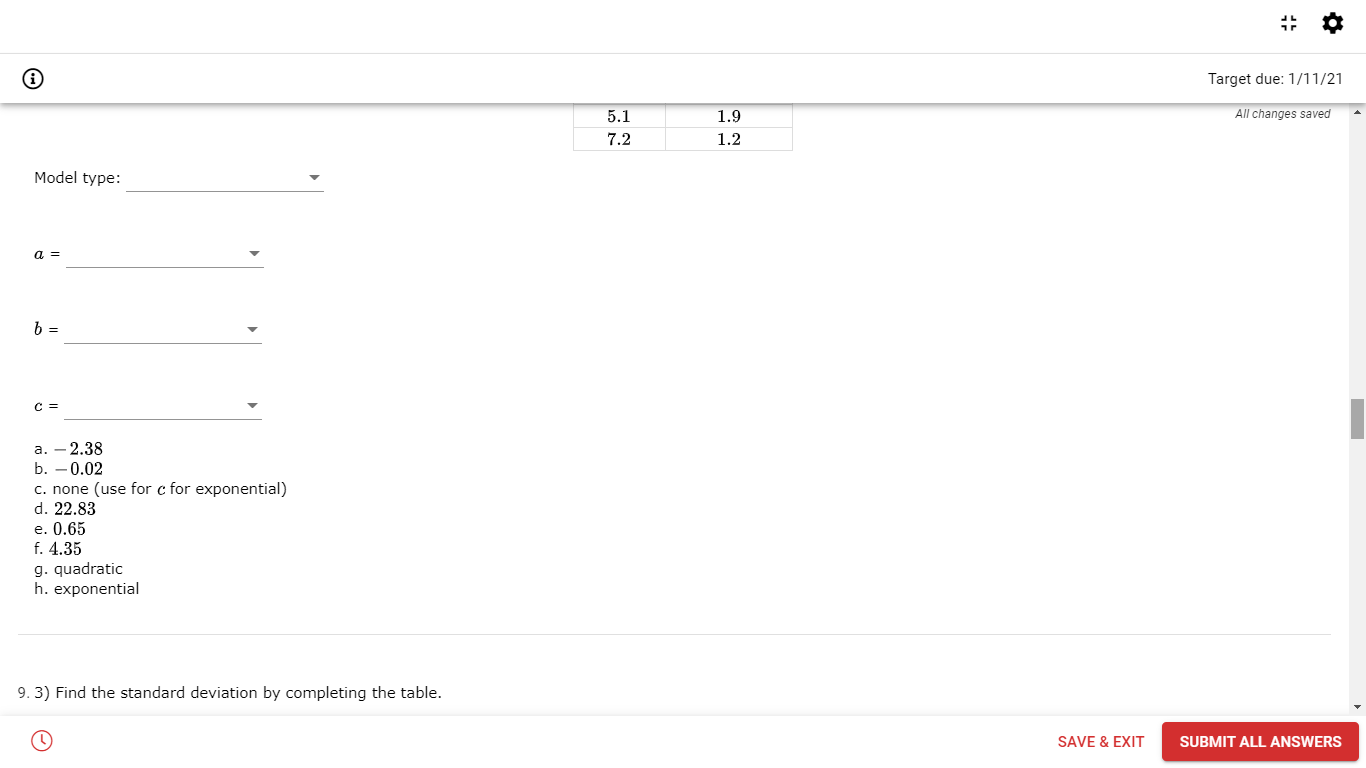
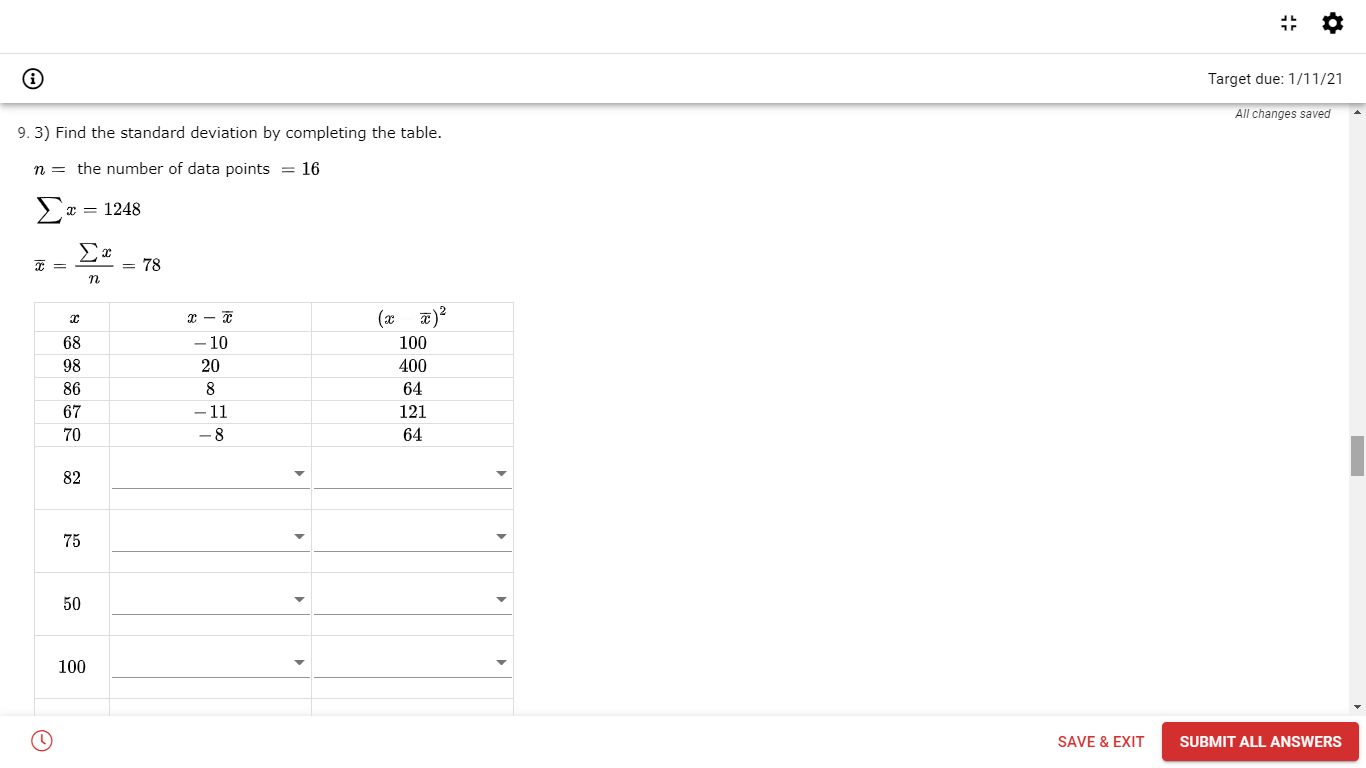
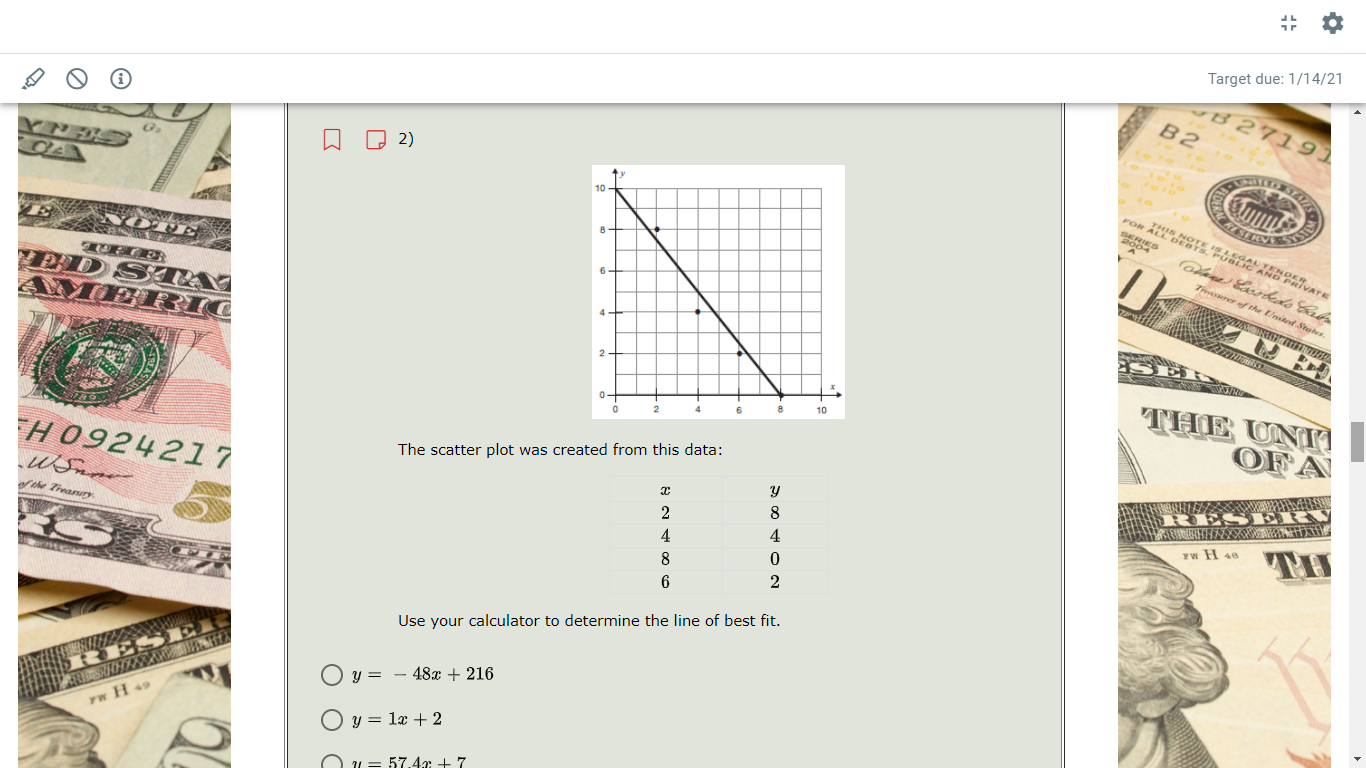
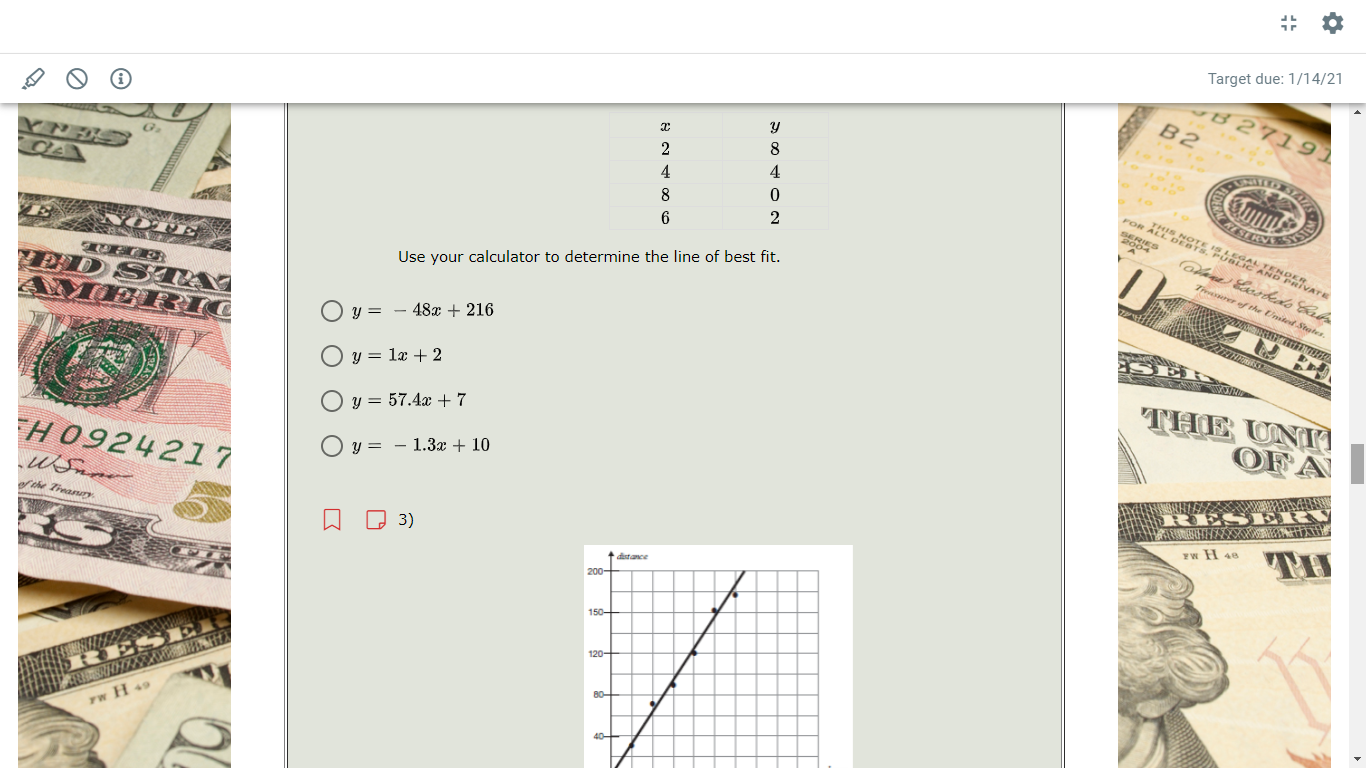
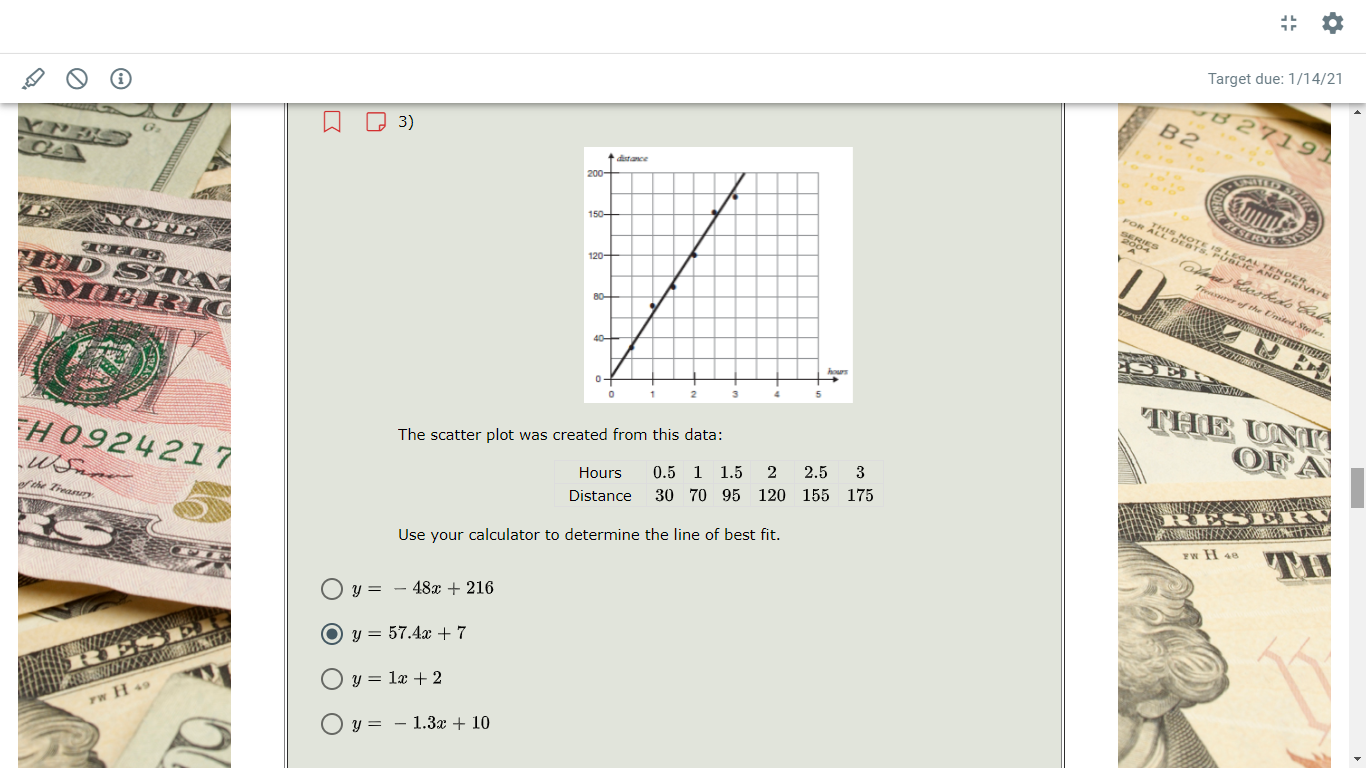
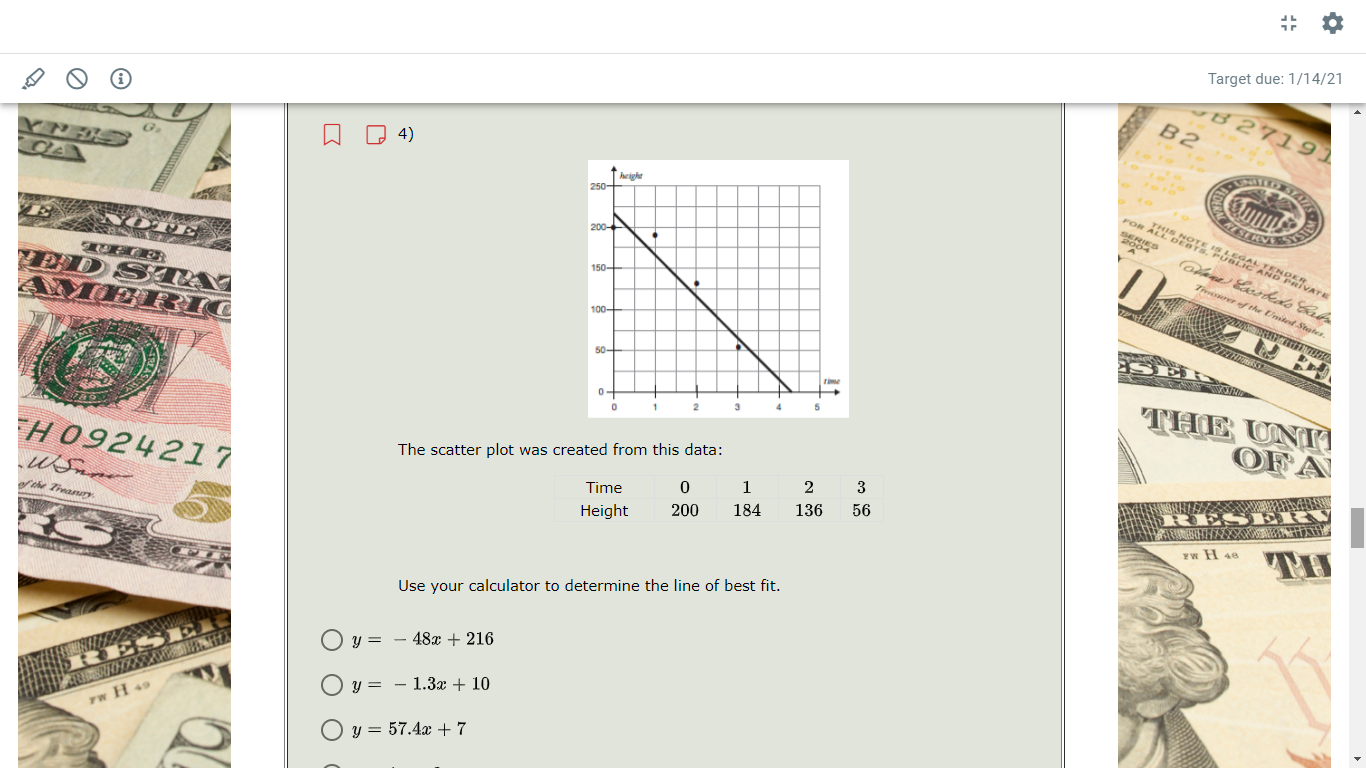
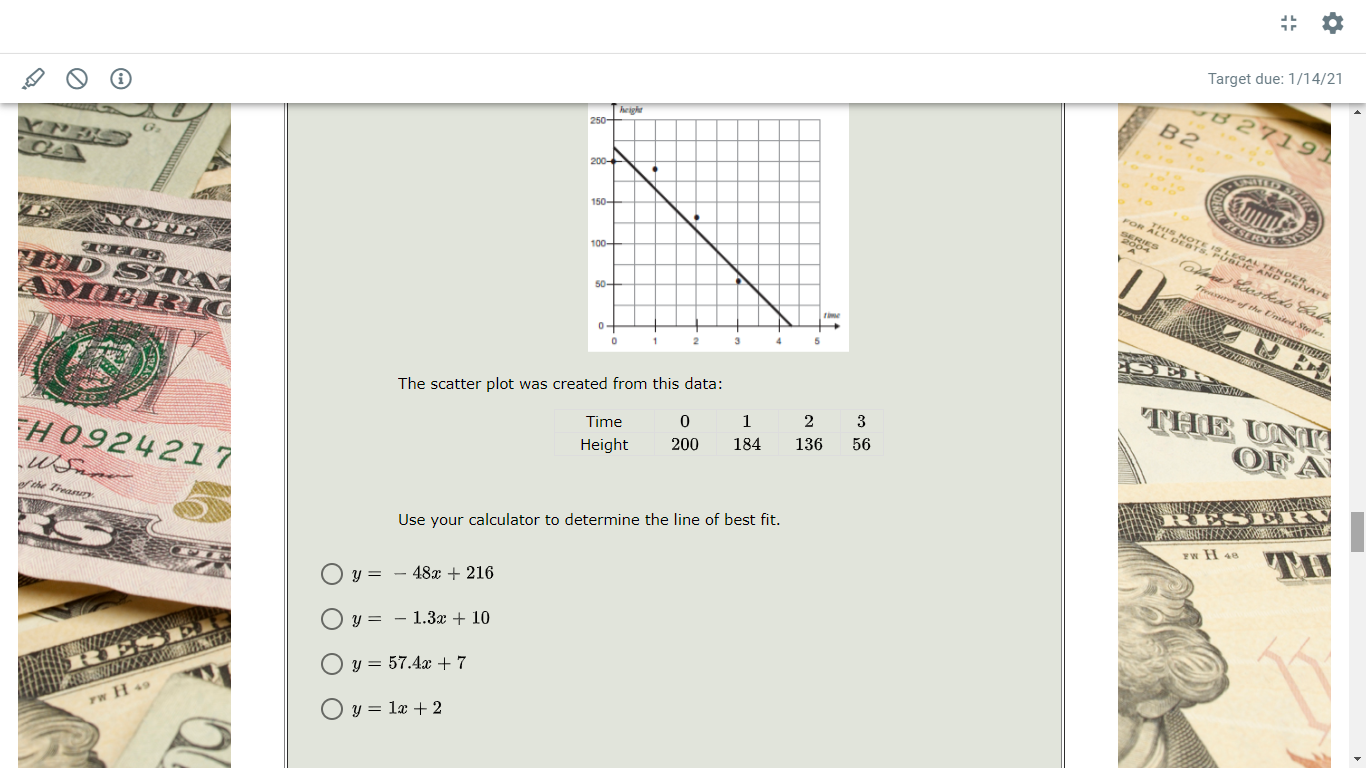
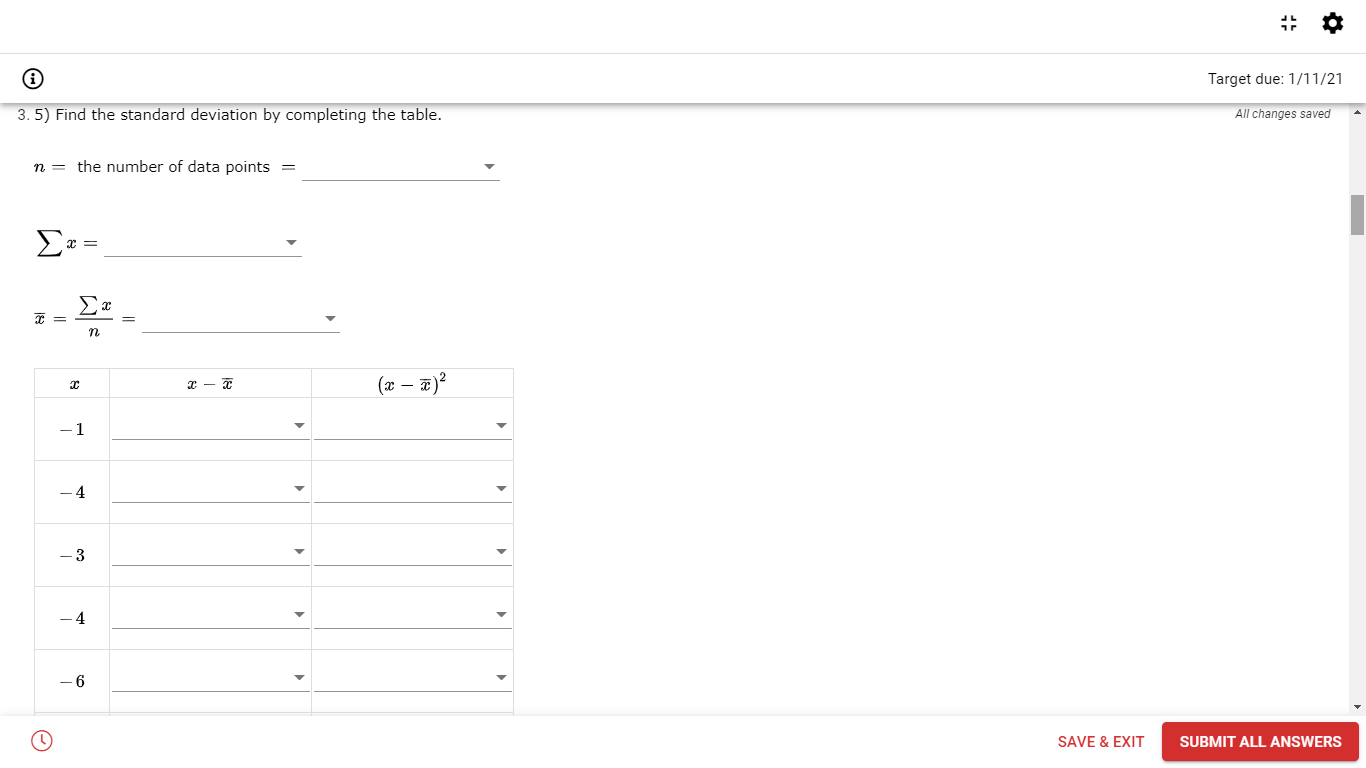
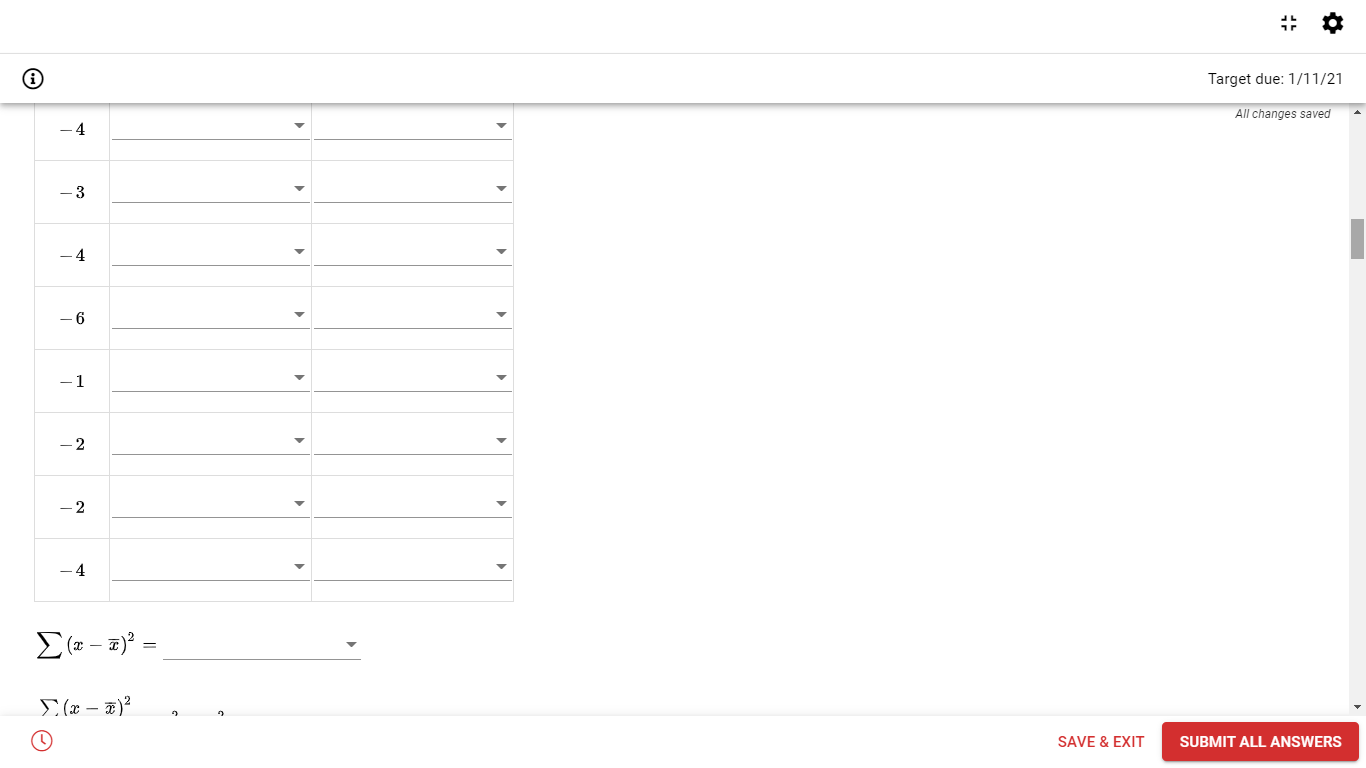
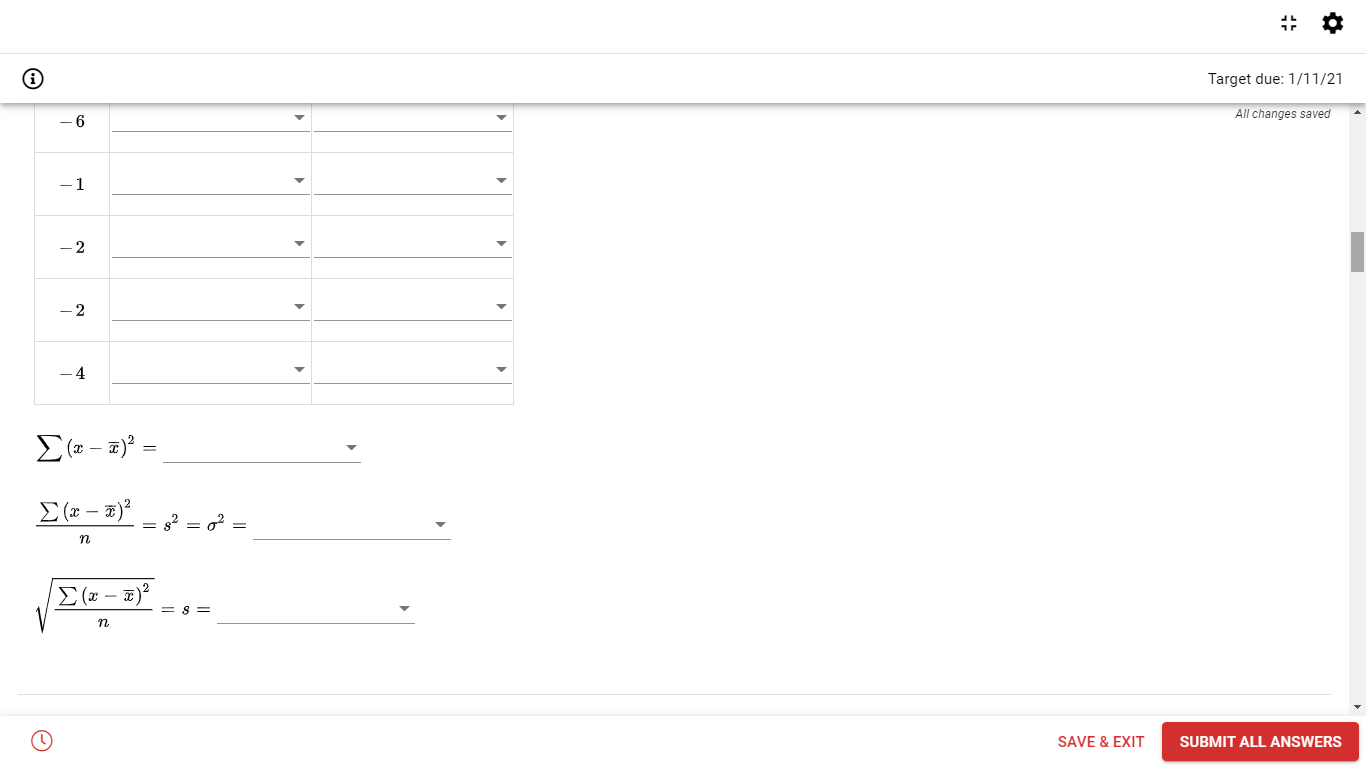
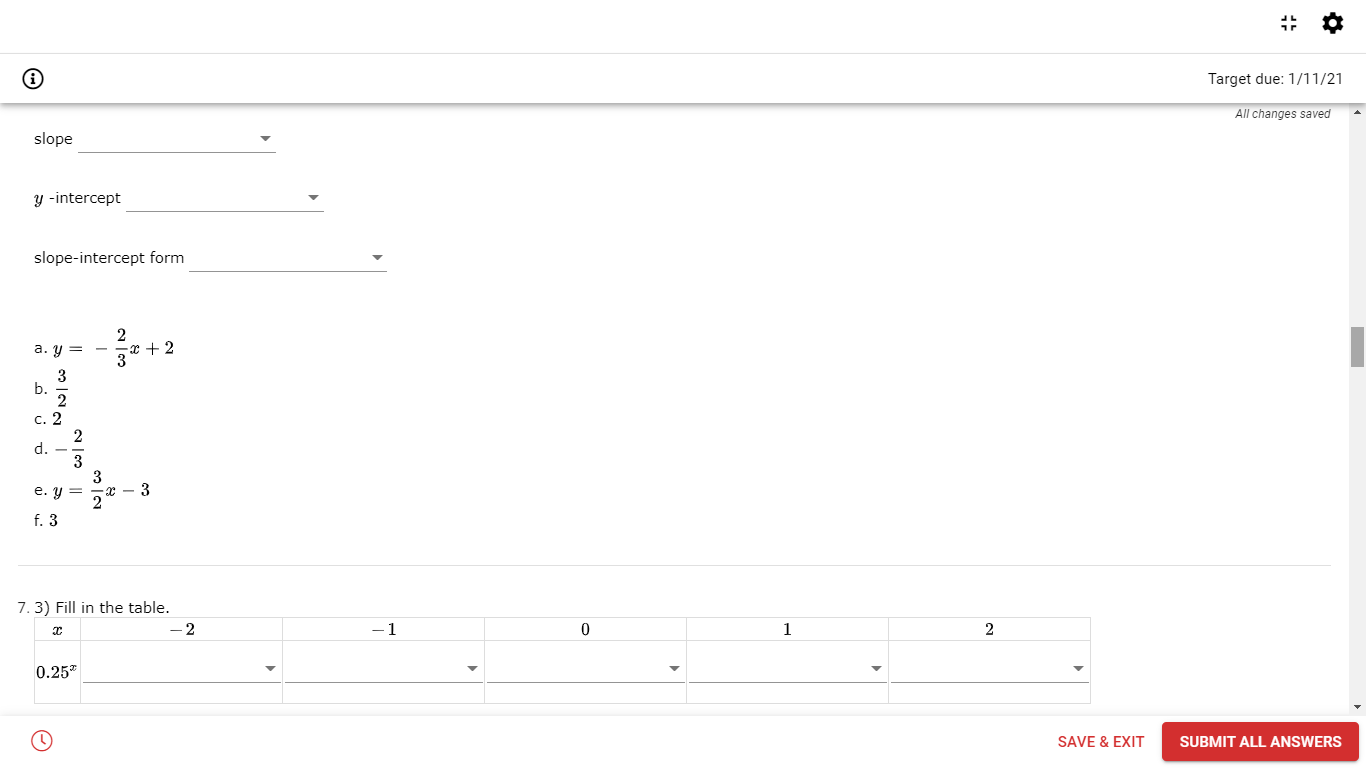
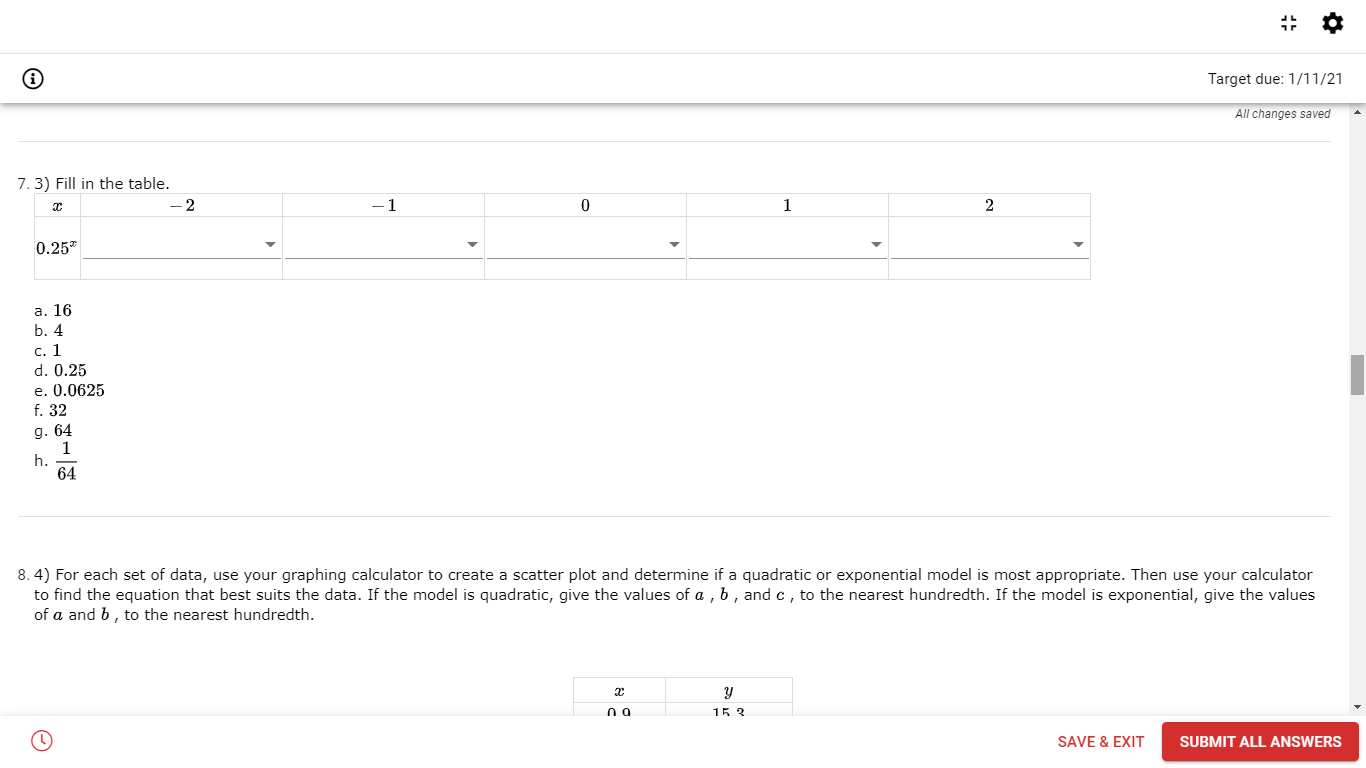
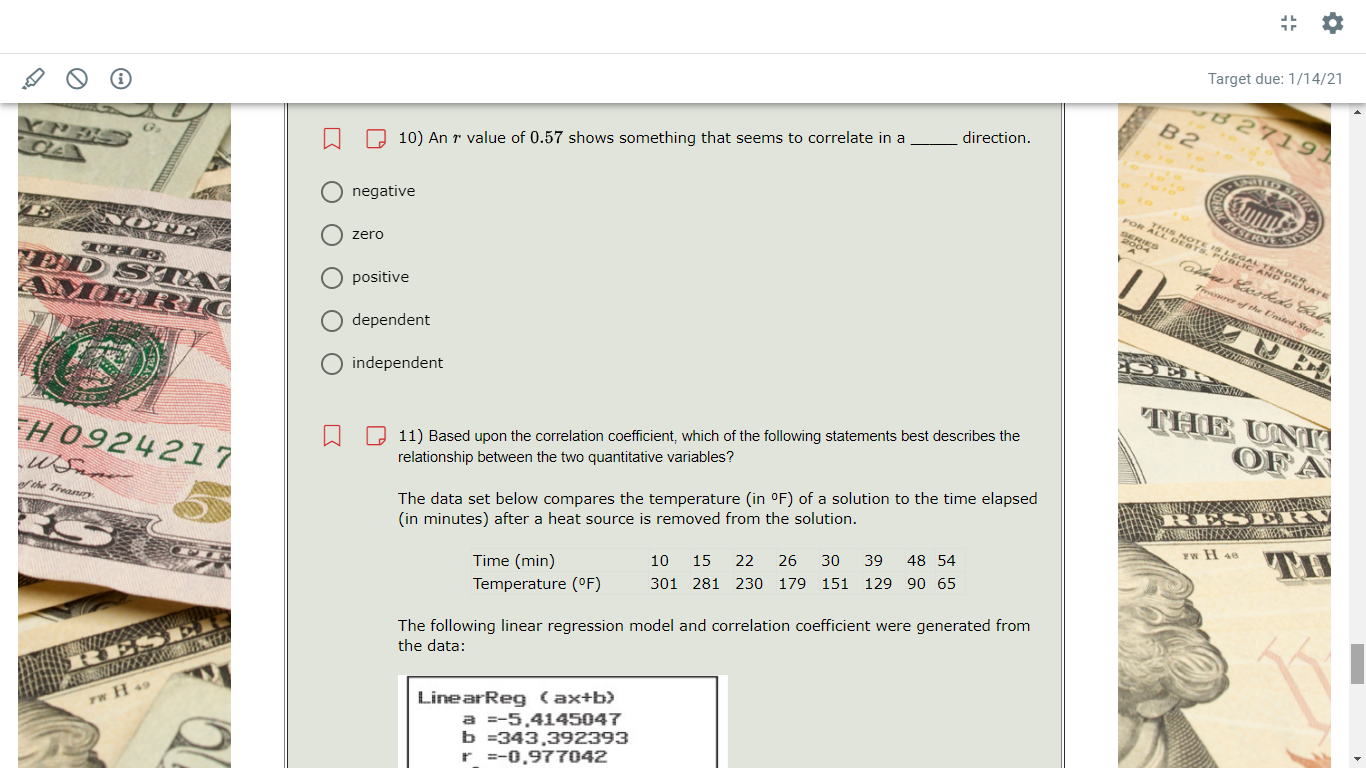
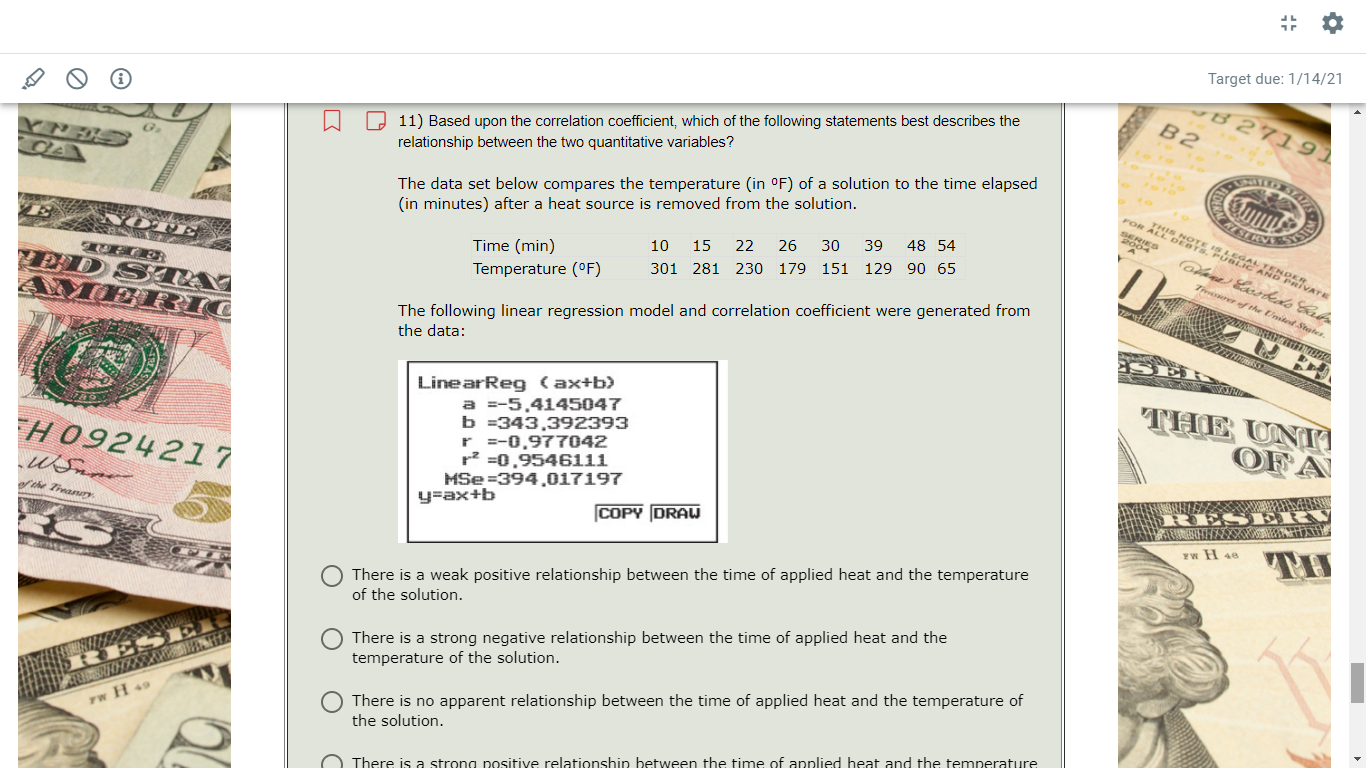
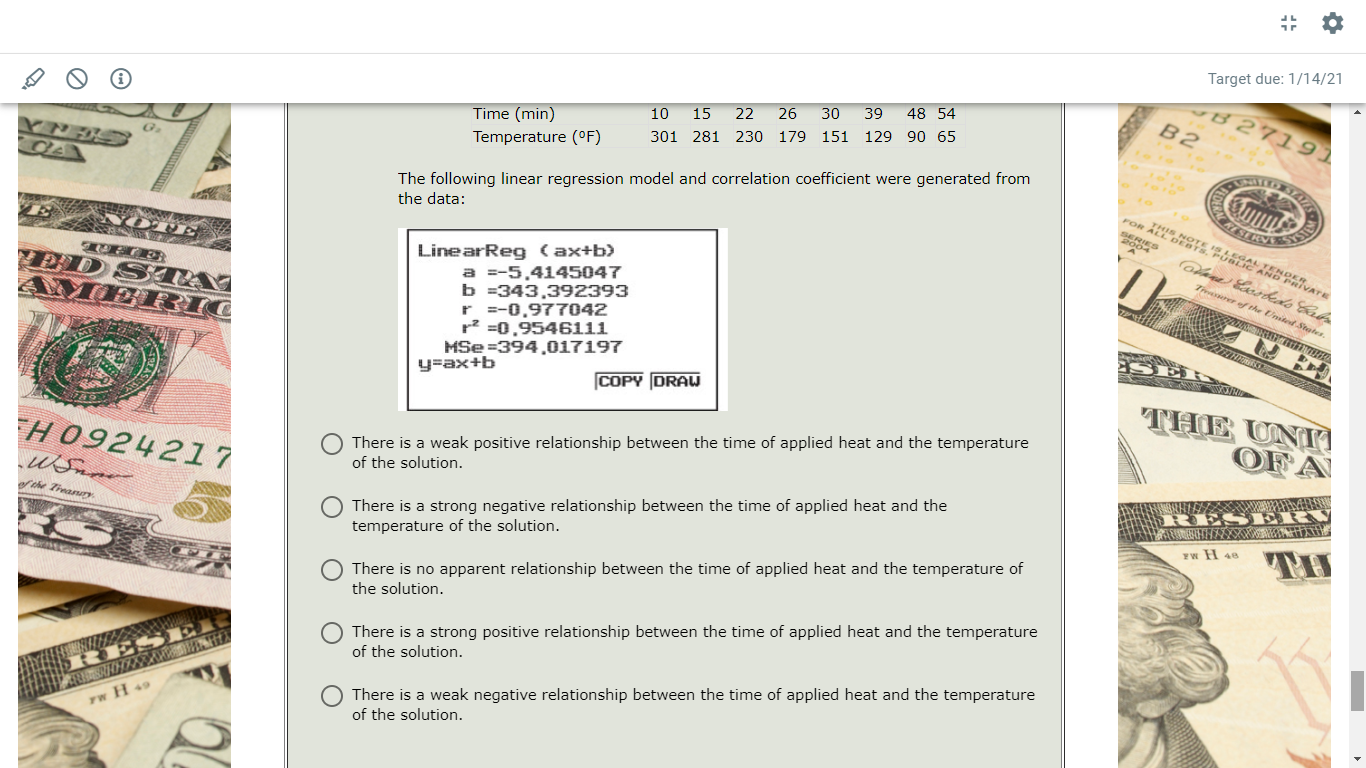
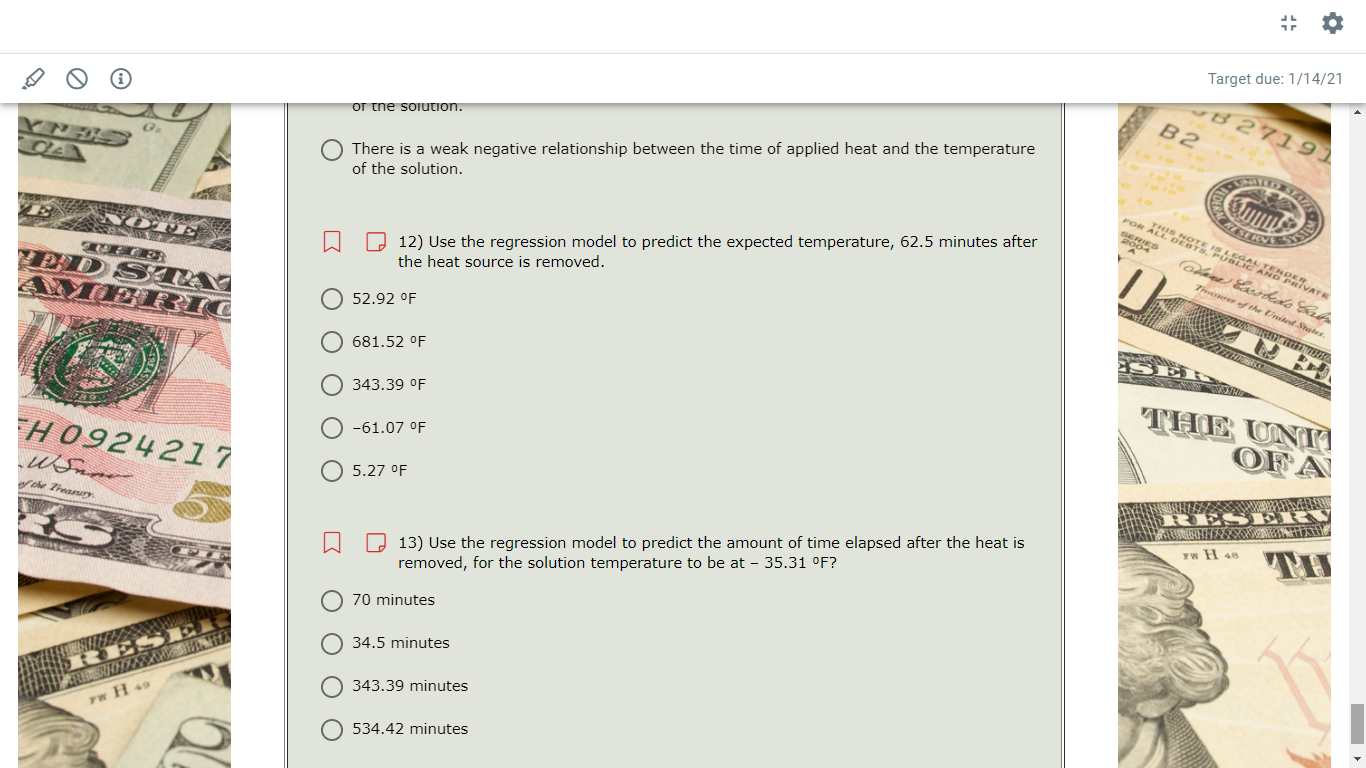
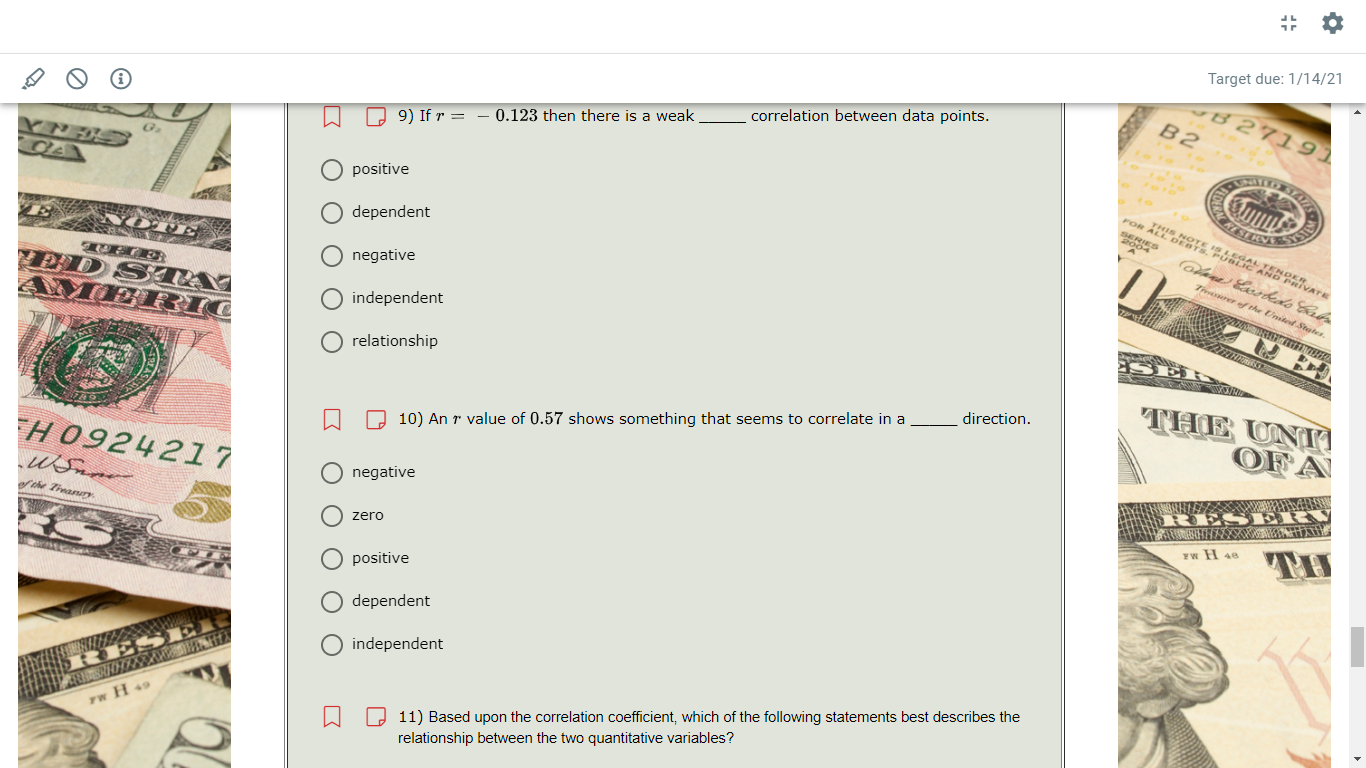
Target due: 1/11/21 All changes saved 8. 4) For each set of data, use your graphing calculator to create a scatter plot and determine if a quadratic or exponential model is most appropriate. Then use your calculator to find the equation that best suits the data. If the model is quadratic, give the values of a , b , and c , to the nearest hundredth. If the model is exponential, give the values of a and b , to the nearest hundredth. y 0.9 15.3 2.8 7.8 4.1 4.2 5.1 1.9 7.2 1.2 Model type: a = b = C = a. - 2.38 h. - 0.02 SAVE & EXIT SUBMIT ALL ANSWERSTarget due: 1/11/21 5.1 1.9 All changes saved 7.2 1.2 Model type: a = b = C = a. - 2.38 b. - 0.02 c. none (use for c for exponential) d. 22.83 e. 0.65 f. 4.35 g. quadratic h. exponential 9. 3) Find the standard deviation by completing the table. SAVE & EXIT SUBMIT ALL ANSWERSTarget due: 1/11/21 9. 3) Find the standard deviation by completing the table. All changes saved n = the number of data points = 16 * = 1248 = = 78 68 - 10 100 98 20 400 86 8 64 67 - 11 121 70 - 8 64 82 75 50 100 SAVE & EXIT SUBMIT ALL ANSWERSG) Target due: 'lr'1'll2'l 11. 14] The cell phone plan you purchased costs a at fee of $19.99 per month, plus E5 cents for each minute used per month. What is the slope of the equation to AH changes saved ' cell phone plan? V What equation will show the cost per month of this plan? V a. 23centsfminute b. c = 23m + 1999 C. $19.99/month d. c = $19.99m + 23 12. 3) Solve the problem. Carlos created the following monthly budget: $350 for food, $320 for transportation, $950 for housing, and $275 for personal expenses. Working a 40hour week, how much must he make per hour to meet his projected expenses? Assume there will be 4 weeks in each month. 0 $18.25 per hour I 0 $14.50 per hour 0 $7.25 per hour 0 $11.85 per hour ' (9 SAVE a. EXIT SUBMIT ALL ANSWERS 111e scatter plot was created from this data: Use your calculator to determine the line of best t. 0y: 48:u+216 01* n1: 1w+2 57,45: 4- 'r' Target due: 1/14/21 B2719 B2 NOOOO CALSERVIESIS SERIES 2004 FOR ALL DEBTS. PUBLIC AND PRIVATE Iwassever of the United States. Use your calculator to determine the line of best fit. ED STAY Oy= - 48x + 216 AMERIC THE UNIT Oy = 1x + 2 OFA O y = 57.4x: + 7 Oy= - 1.3x + 10 Yw H 48 H 0924217 of the Treasury W Q3) 200- 120- rw H 49111a scatter plot was created from [his data: Hours 0.5 l 1.5 2 2.5 3 Distance 30 70 95 120 155 1'?5 Use your calwlator to detemline the line of best t. 0 y = 48:: + 216 1; = 57.45; + 7 O y = 1n: + 2 0y: 1.3:z:+10 111e scatter plot was created from this data: \"me 0 1 Height 200 134 Use your calculator to determine the line of best t. 01;: 4Bz+216 0y: 1.3n:+10 O y=57.4a;+7 136 56 Target due: 1/14/21 height 250- B2 B2719 200- 150- CALSERVIESIS SERIES 100- 2004 FOR ALL DEBTS. PUBLIC AND PRIVATE ED STAY AMERIC Iwassover of the United States. The scatter plot was created from this data: Time 0 1 2 3 THE UNIT H 0924217 Height 200 184 136 56 OFA of the Treasury Use your calculator to determine the line of best fit. Yw H 48 Oy= - 48x + 216 TH Oy= - 1.3x + 10 O y = 57.4x: + 7 rw H 49 Oy = 1x +2G) Target due: M 1m 3. 5] Find the standard deviation by completing the table. All changes saved ' n = the number of data points = v 2w: - h: - ' 2 a: 375 {atE) _1 v v ,4 v v _3 v v ,4 v v _6 V v SAVE a. EXIT SUBMIT ALL ANSWERS \f\fTarget due: 1/11/21 All changes saved slope y -intercept slope-intercept form a. y = +2 b 10 10 / 00 C. d. e. y = ac 3 f. 3 7. 3) Fill in the table. - 2 -1 0 1 2 0.25 SAVE & EXIT SUBMIT ALL ANSWERSG) Target due: in 1.01 AM changes saved ' 7. 3] Fill in the table. 3 2 1 {l l 2 0.253 v v v v v 8. 4] For each set of data, use your graphing calculator to create a scatter plot and determine if a quadratic or exponential model is most appropriate. Then use your calculator to nd the equation that best suits the data. If the model is quadratic, give the values of a , b , and c , to the nearest hundredth. 1f the model is exponential, give the values Dfa and b , to the neart hundredth. no 13? (9 SAVE a. EXIT SUBMIT ALL ANSWERS Target due: 1/14/21 10) An r value of 0.57 shows something that seems to correlate in a direction. B2 B2719 negative zero CALSERVIESIS SERIES 2004 FOR ALL DEBTS. PUBLIC AND PRIVATE ED STAY positive AMERIC Iwassever of the United States. O dependent independent 11) Based upon the correlation coefficient, which of the following statements best describes the THE UNI H 0924217 relationship between the two quantitative variables? OFA of the Treasury The data set below compares the temperature (in OF) of a solution to the time elapsed (in minutes) after a heat source is removed from the solution. Time (min) 10 15 22 26 30 39 48 54 Yw H 48 TH Temperature (OF) 301 281 230 179 151 129 90 65 The following linear regression model and correlation coefficient were generated from the data: rw H 49 LinearReg ( ax+b) a =-5.4145047 b =343.392393 r =-0.97 7042Target due: 1/14/21 11) Based upon the correlation coefficient, which of the following statements best describes the B2 B2719 relationship between the two quantitative variables? The data set below compares the temperature (in OF) of a solution to the time elapsed (in minutes) after a heat source is removed from the solution. CALSERVIESIS 10 15 22 26 6 30 39 SERIES Time (min) 48 54 2004 FOR ALL DEBTS. PUBLIC AND PRIVATE ED STAY Temperature (OF) 301 281 230 179 151 129 90 65 AMERIC The following linear regression model and correlation coefficient were generated from Iwassover of the United States. the data: LinearReg ( ax+b) a =-5.4145047 b =343.392393 THE UNI H 0924217 r =-0.97 7042 12 =0.9546111 OFA MSe=394.017197 of the Treasury y=ax+b COPY DRAW Yw H 48 TH There is a weak positive relationship between the time of applied heat and the temperature of the solution. There is a strong negative relationship between the time of applied heat and the temperature of the solution. rw H 49 There is no apparent relationship between the time of applied heat and the temperature of the solution.Target due: 1/14/21 Time (min) 10 15 5 22 26 30 39 48 54 Temperature (OF) 301 281 230 179 151 129 90 65 B2 B2719 The following linear regression model and correlation coefficient were generated from the data: CALSERVIESIS SERIES LinearReg ( ax+b) 2004 FOR ALL DEBTS. PUBLIC AND PRIVATE ED STAY a =-5.4145047 AMERIC b =343.392393 r =-0.97 7042 Iwassover of the United States. 12 =0.9546111 MSe =394.017197 y=ax+b COPY DRAW THE UNI H 0924217 There is a weak positive relationship between the time of applied heat and the temperature of the solution. OFA of the Treasury There is a strong negative relationship between the time of applied heat and the temperature of the solution. There is no apparent relationship between the time of applied heat and the temperature of TH the solution. There is a strong positive relationship between the time of applied heat and the temperature of the solution. rw H 49 There is a weak negative relationship between the time of applied heat and the temperature of the solution.0 There is a weak negative relationship between the time of applied heat and tire temperature of the solution. D 12) Use the regression model to predict the expected temperature, 62.5 minutes after the heat source is removed. 52.92 0F 681.52 GF 343.39 \"F 61.07 9F 5.27 \"F D 13) Use the regression model to predict the amount of time elapsed after the heat is removed, for re solution temperature to be at 7 35.31 "F? 70 minutes 34.5 minut 343.39 minutes 534.42 minutes 0000 B 00000 D Target due: 1/14/21 W Q9) Ifr = - 0.123 then there is a weak correlation between data points. B2 B2719 positive dependent SERIES CALSERVIESIS 2004 O negative FOR ALL DEBTS. PUBLIC AND PRIVATE ED STAY AMERIC O independent Iwassover of the United States. relationship 10) An r value of 0.57 shows something that seems to correlate in a direction. H 0924217 THE UNI negative OFA of the Treasury zero O positive FW H 48 dependent independent rw H 49 11) Based upon the correlation coefficient, which of the following statements best describes the relationship between the two quantitative variables
Step by Step Solution
There are 3 Steps involved in it

Get step-by-step solutions from verified subject matter experts