

Question: Questions are pictured use google for the graphs Locate 5 graphs/charts online, copy and place them into a Word/Pages document. Then go through and make
Questions are pictured use google for the graphs
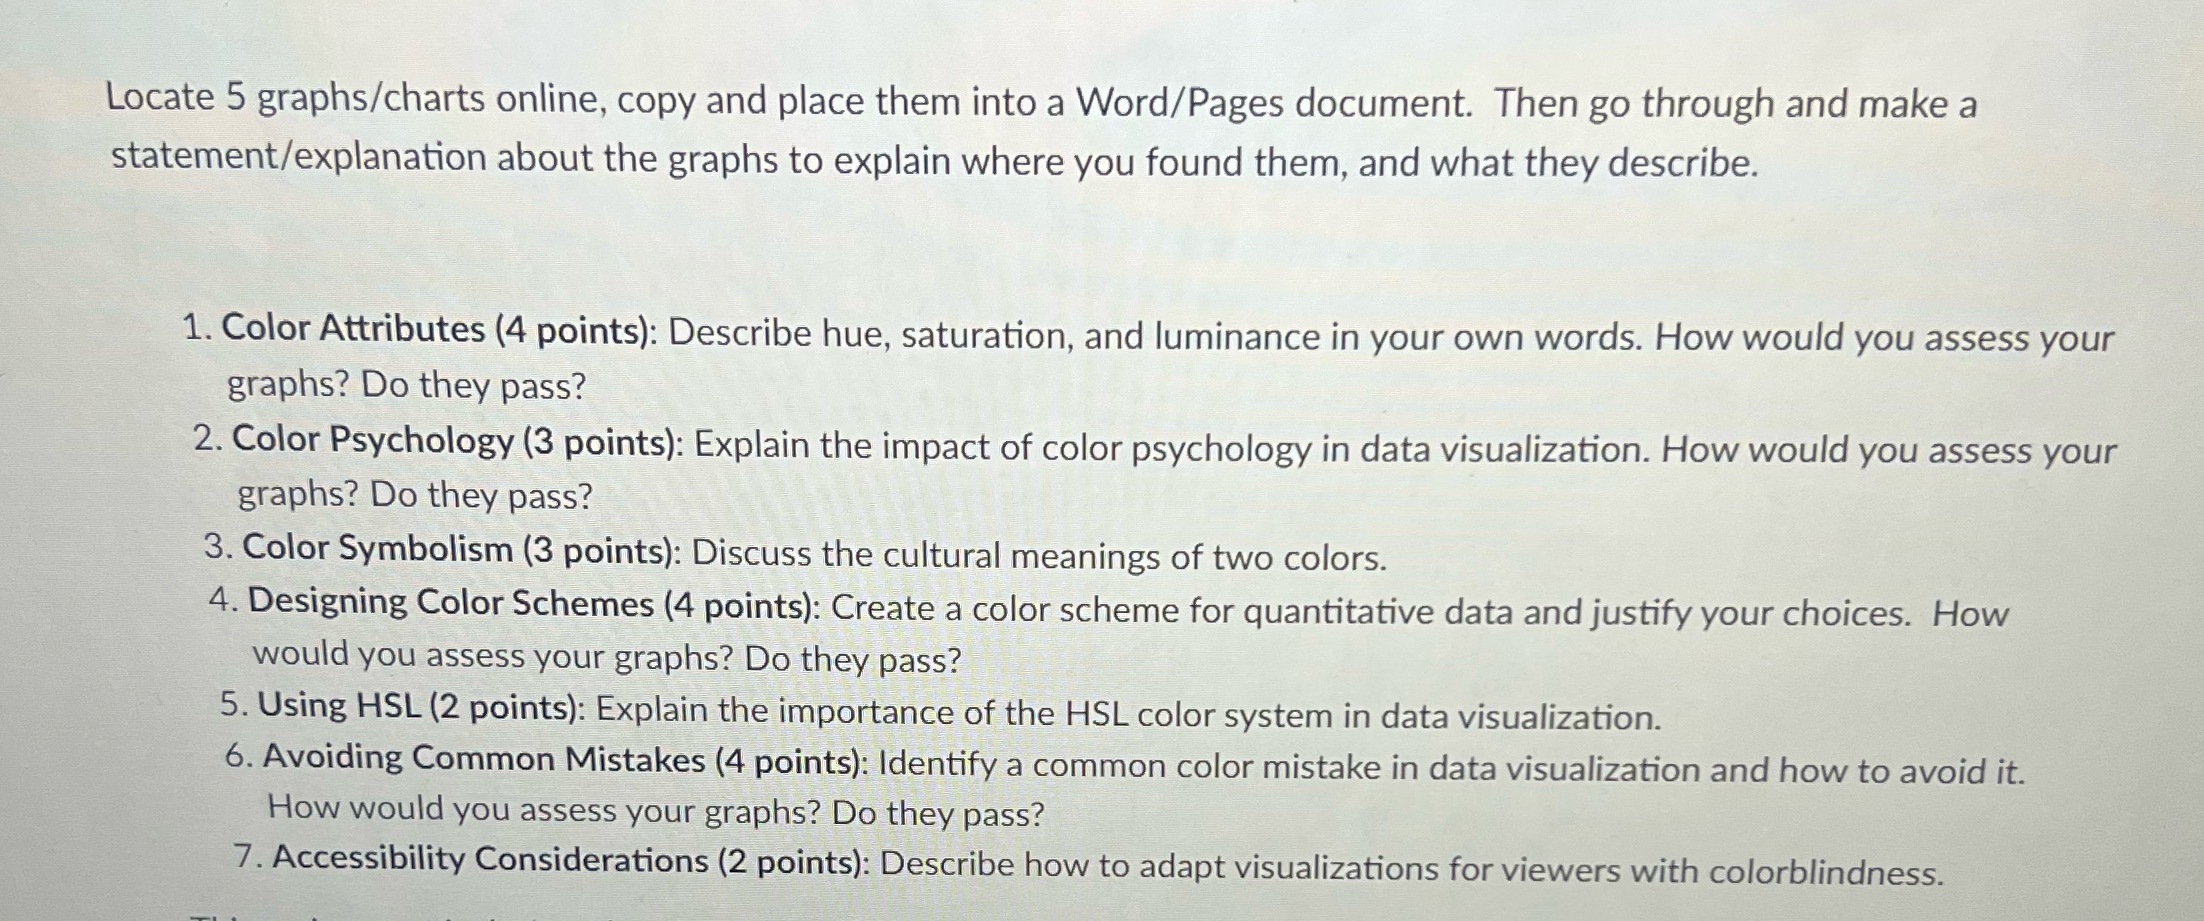
Locate 5 graphs/charts online, copy and place them into a Word/Pages document. Then go through and make a statement/explanation about the graphs to explain where you found them, and what they describe. 1. Color Attributes (4 points): Describe hue, saturation, and luminance in your own words. How would you assess your graphs? Do they pass? 2. Color Psychology (3 points): Explain the impact of color psychology in data visualization. How would you assess your graphs? Do they pass? 3. Color Symbolism (3 points): Discuss the cultural meanings of two colors. 4. Designing Color Schemes (4 points): Create a color scheme for quantitative data and justify your choices. How would you assess your graphs? Do they pass? 5. Using HSL (2 points): Explain the importance of the HSL color system in data visualization. 6. Avoiding Common Mistakes (4 points): Identify a common color mistake in data visualization and how to avoid it. How would you assess your graphs? Do they pass? 7. Accessibility Considerations (2 points): Describe how to adapt visualizations for viewers with colorblindness
Step by Step Solution
There are 3 Steps involved in it

Get step-by-step solutions from verified subject matter experts