

Question: Questions: Data: Please show the whole solution and in Excel. Thank you! 6ANCOVA #1: Conduct a correlation test between the pre and post scores. Is
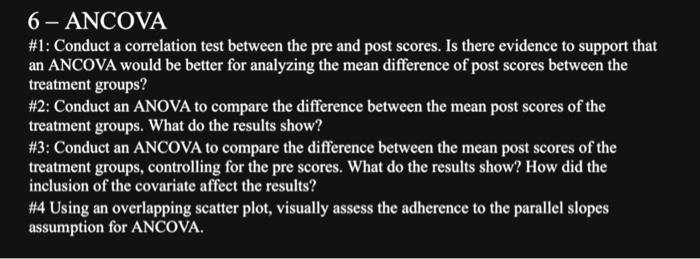

6ANCOVA #1: Conduct a correlation test between the pre and post scores. Is there evidence to support that an ANCOVA would be better for analyzing the mean difference of post scores between the treatment groups? #2: Conduct an ANOVA to compare the difference between the mean post scores of the treatment groups. What do the results show? #3: Conduct an ANCOVA to compare the difference between the mean post scores of the treatment groups, controlling for the pre scores. What do the results show? How did the inclusion of the covariate affect the results? #4 Using an overlapping scatter plot, visually assess the adherence to the parallel slopes assumption for ANCOVA. 6ANCOVA #1: Conduct a correlation test between the pre and post scores. Is there evidence to support that an ANCOVA would be better for analyzing the mean difference of post scores between the treatment groups? #2: Conduct an ANOVA to compare the difference between the mean post scores of the treatment groups. What do the results show? #3: Conduct an ANCOVA to compare the difference between the mean post scores of the treatment groups, controlling for the pre scores. What do the results show? How did the inclusion of the covariate affect the results? #4 Using an overlapping scatter plot, visually assess the adherence to the parallel slopes assumption for ANCOVA
Step by Step Solution
There are 3 Steps involved in it

Get step-by-step solutions from verified subject matter experts