

Question: Questions for Section 2. Figures 2 and 3 are examples of poor graphs. Identify what type of charts they are and what they should be.
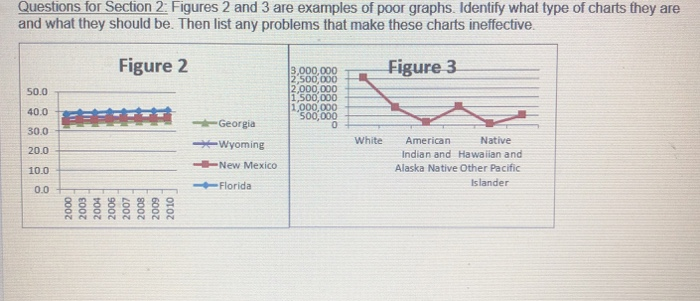
Questions for Section 2. Figures 2 and 3 are examples of poor graphs. Identify what type of charts they are and what they should be. Then list any problems that make these charts ineffective. Figure 2 Figure 3 50.0 3,000,000 2,500,000 2,000,000 1.500,000 1,000,000 500 000 40.0 30.0 White 20.0 Georgia Wyoming New Mexico Florida American Native Indian and Hawaiian and Alaska Native Other Pacific Islander 10.0 0.0 2007 2008 2009 2010
Step by Step Solution
There are 3 Steps involved in it
1 Expert Approved Answer
Step: 1 Unlock

Question Has Been Solved by an Expert!
Get step-by-step solutions from verified subject matter experts
Step: 2 Unlock
Step: 3 Unlock