

Question: Questions from quantitative methods in social science PROBLEM SET 4 Section 1: Hypothesis Testing by Comparing Means & Proportions (number of points) 1. You are
Questions from quantitative methods in social science
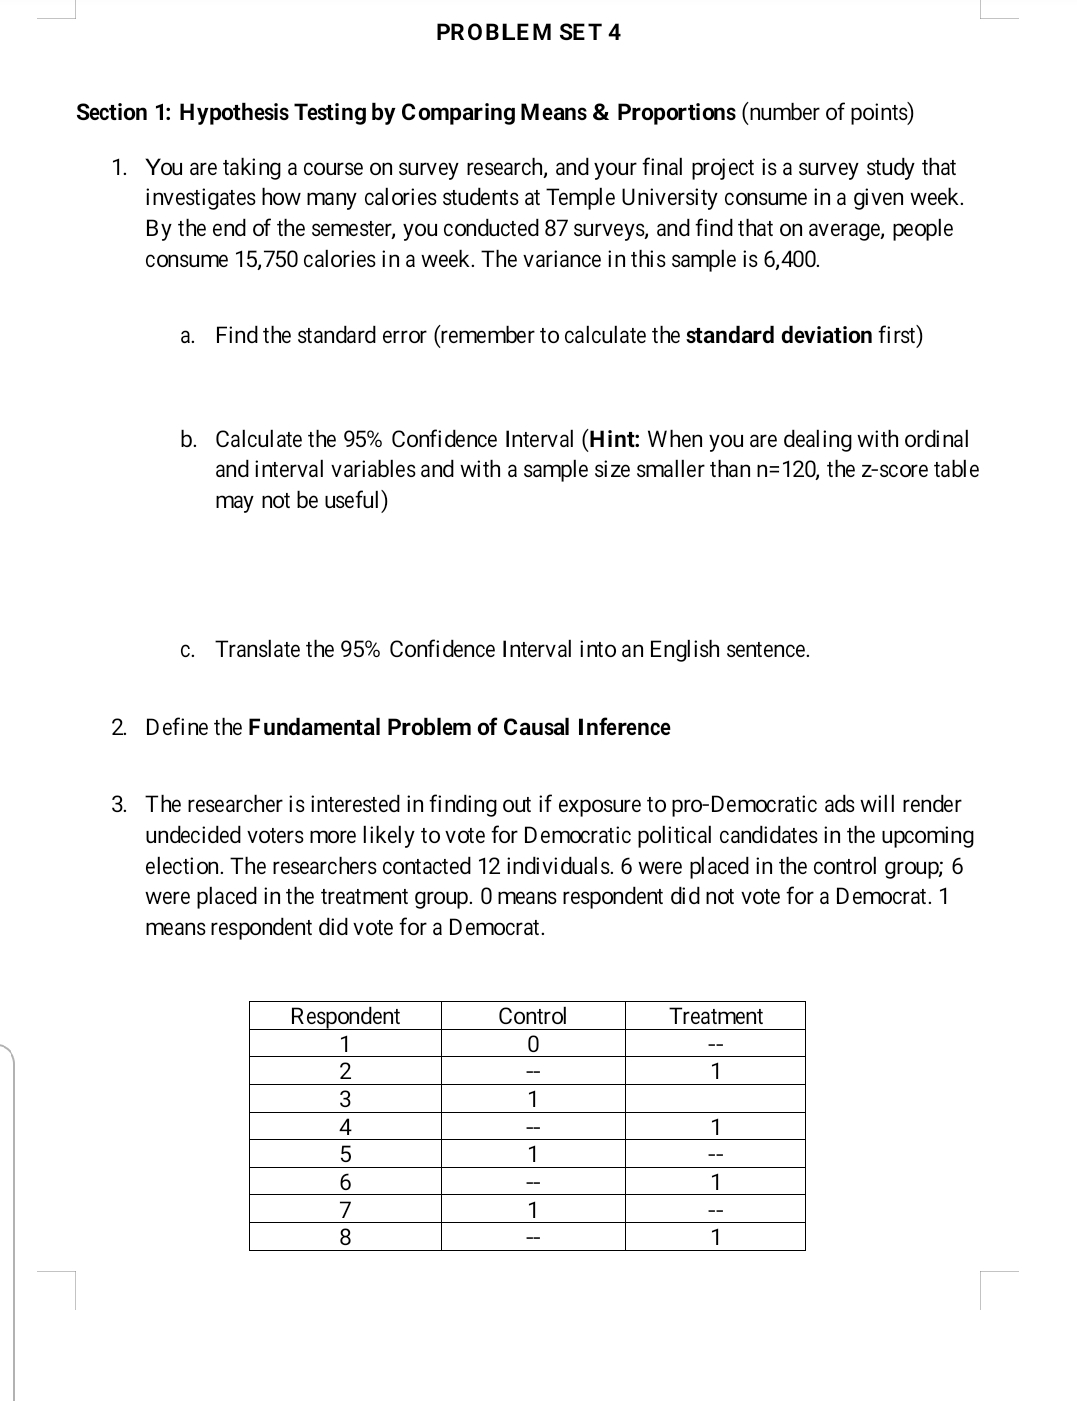
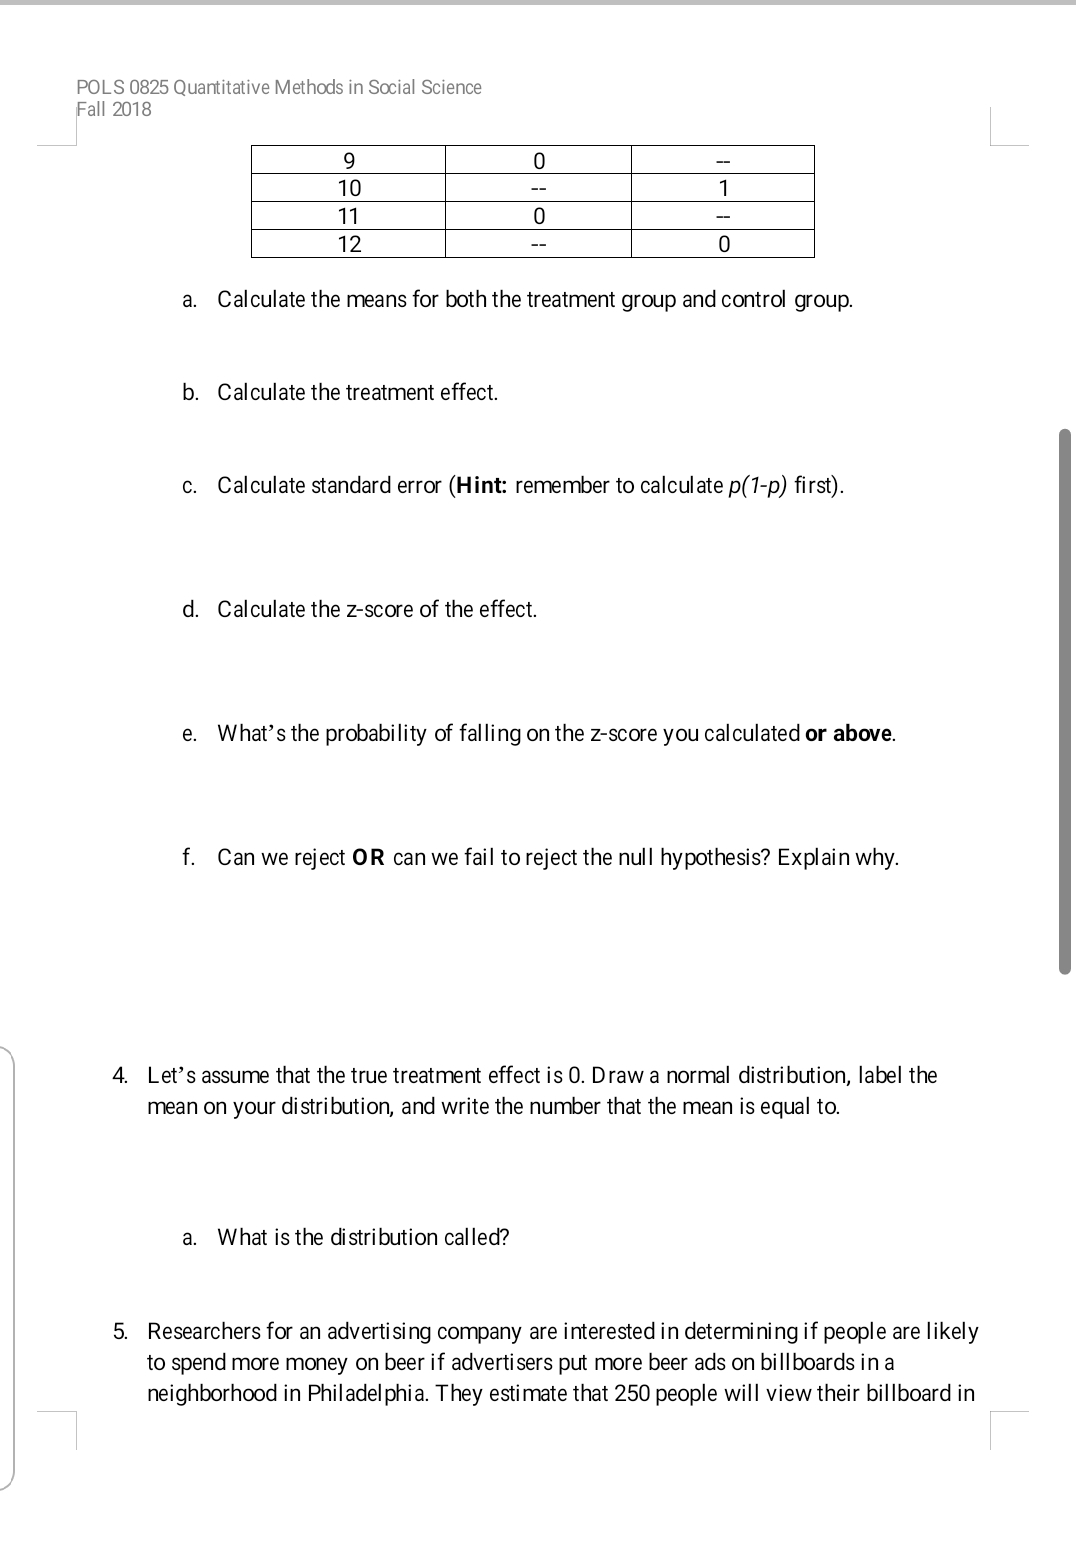
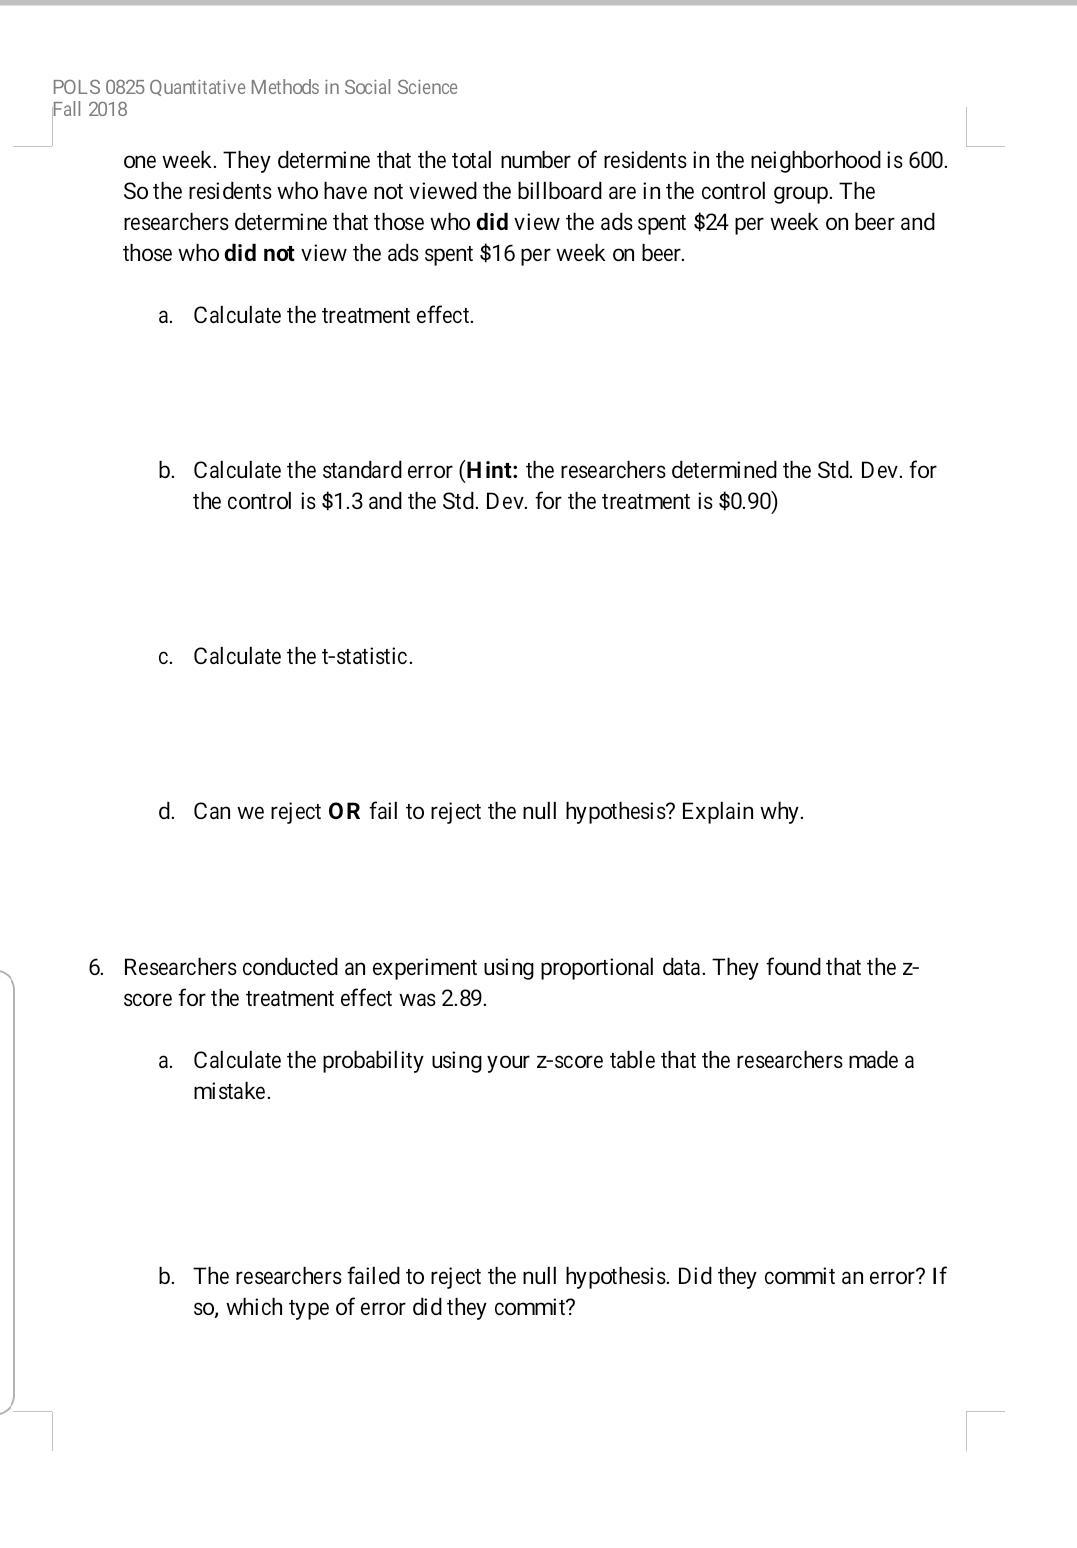
PROBLEM SET 4 Section 1: Hypothesis Testing by Comparing Means & Proportions (number of points) 1. You are taking a course on survey research, and your final project is a survey study that investigates how many calories students at Temple University consume in a given week. By the end of the semester, you conducted 87 surveys, and find that on average, people consume 15,750 calories in a week. The variance in this sample is 6,400. a. Find the standard error (remember to calculate the standard deviation first) b. Calculate the 95% Confidence Interval (Hint: When you are dealing with ordinal and interval variables and with a sample size smaller than n=120, the z-score table may not be useful) c. Translate the 95% Confidence Interval into an English sentence. 2. Define the Fundamental Problem of Causal Inference 3. The researcher is interested in finding out if exposure to pro-Democratic ads will render undecided voters more likely to vote for Democratic political candidates in the upcoming election. The researchers contacted 12 individuals. 6 were placed in the control group; 6 were placed in the treatment group. 0 means respondent did not vote for a Democrat. 1 means respondent did vote for a Democrat Respondent Control Treatment 1 0 2 -- 1 3 1 - 1 1 - 1 1 -1 --POLS 0825 Quantitative Methods in Social Science Fall 2018 9 0 L 10 -- 11 0 -1 12 -- a. Calculate the means for both the treatment group and control group. b. Calculate the treatment effect. c. Calculate standard error (Hint: remember to calculate p(1-p) first). d. Calculate the z-score of the effect. e. What's the probability of falling on the z-score you calculated or above. f. Can we reject OR can we fail to reject the null hypothesis? Explain why. 4. Let's assume that the true treatment effect is 0. Draw a normal distribution, label the mean on your distribution, and write the number that the mean is equal to. a. What is the distribution called? 5. Researchers for an advertising company are interested in determining if people are likely to spend more money on beer if advertisers put more beer ads on bill boards in a neighborhood in Philadelphia. They estimate that 250 people will view their billboard inPOLS 0825 Quantitative Methods in Social Science Fall 2018 one week. They determine that the total nurrber of residents in the neighborhood is 600. So the residents who have not viewed the billboard are in the control group. The researchers determine that those who did view the ads spent $24 per week on beer and those who did not view the ads spent $16 per week on beer. a. Calculate the treatment effect. b. Calculate the standard error (H int: the researchers determined the Std. Dev. for the control is $1.3 and the Std. Dev. for the treatment is $0.90) c. Calculate the tstatistic. d. Can we reject 0R fail to reject the null hypothesis? Explain why. 6. Researchers conducted an experiment using proportional data. They found that the z- score for the treatment effect was 2.39. a. Calculate the probability using your zscore table that the researchers made a mistake. b. The researchers failed to reject the null hypothesis. Did they comnit an error? If so, which type of error cd they commit
Step by Step Solution
There are 3 Steps involved in it

Get step-by-step solutions from verified subject matter experts