

Question: questions in image 1 point Q Answer questions 36 through 39 based on the following information. As a researcher in the sociology of family you


questions in image
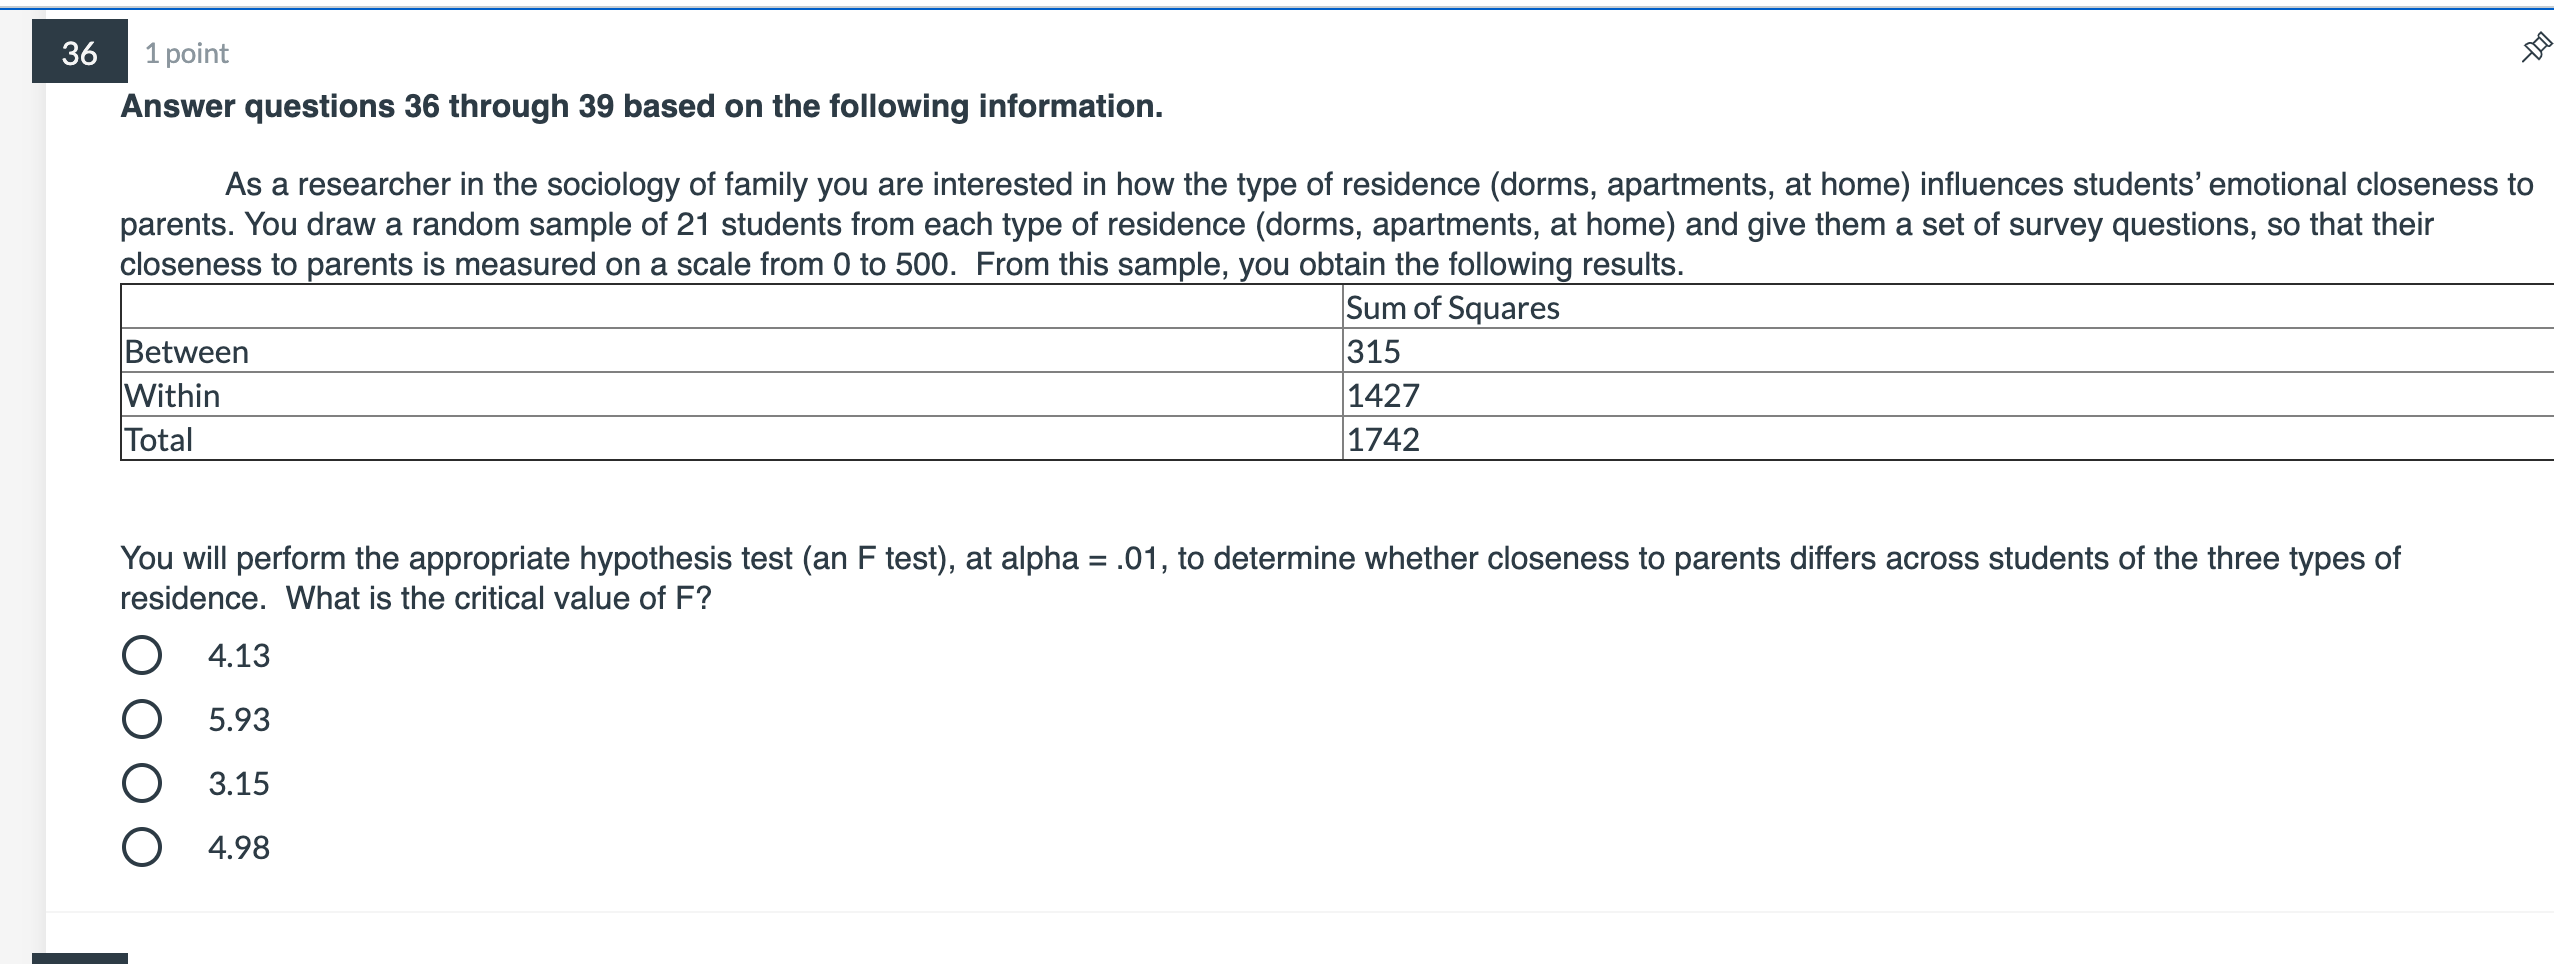
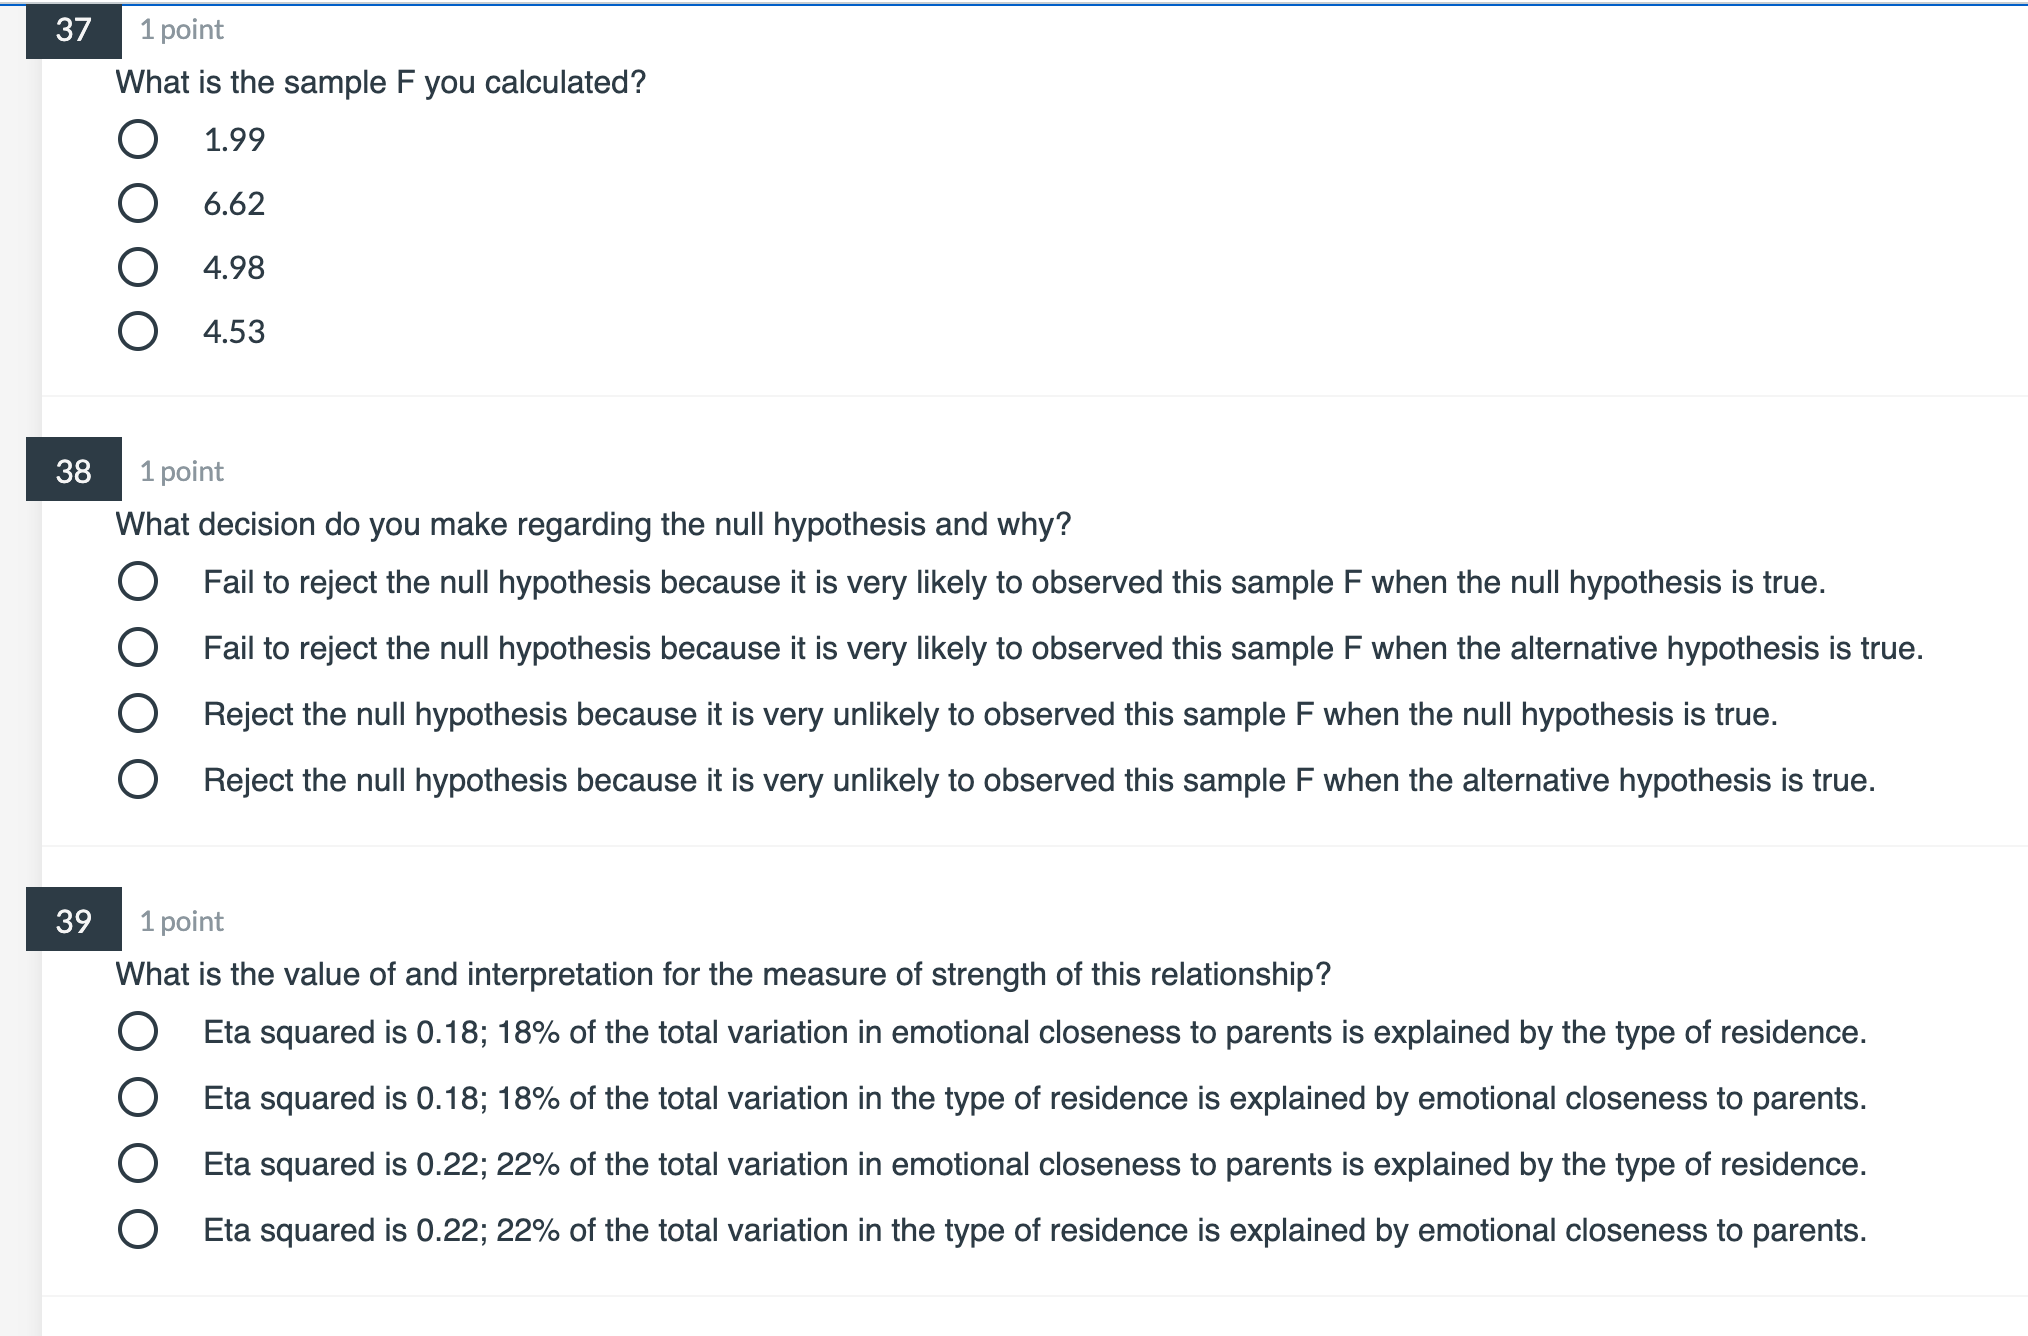


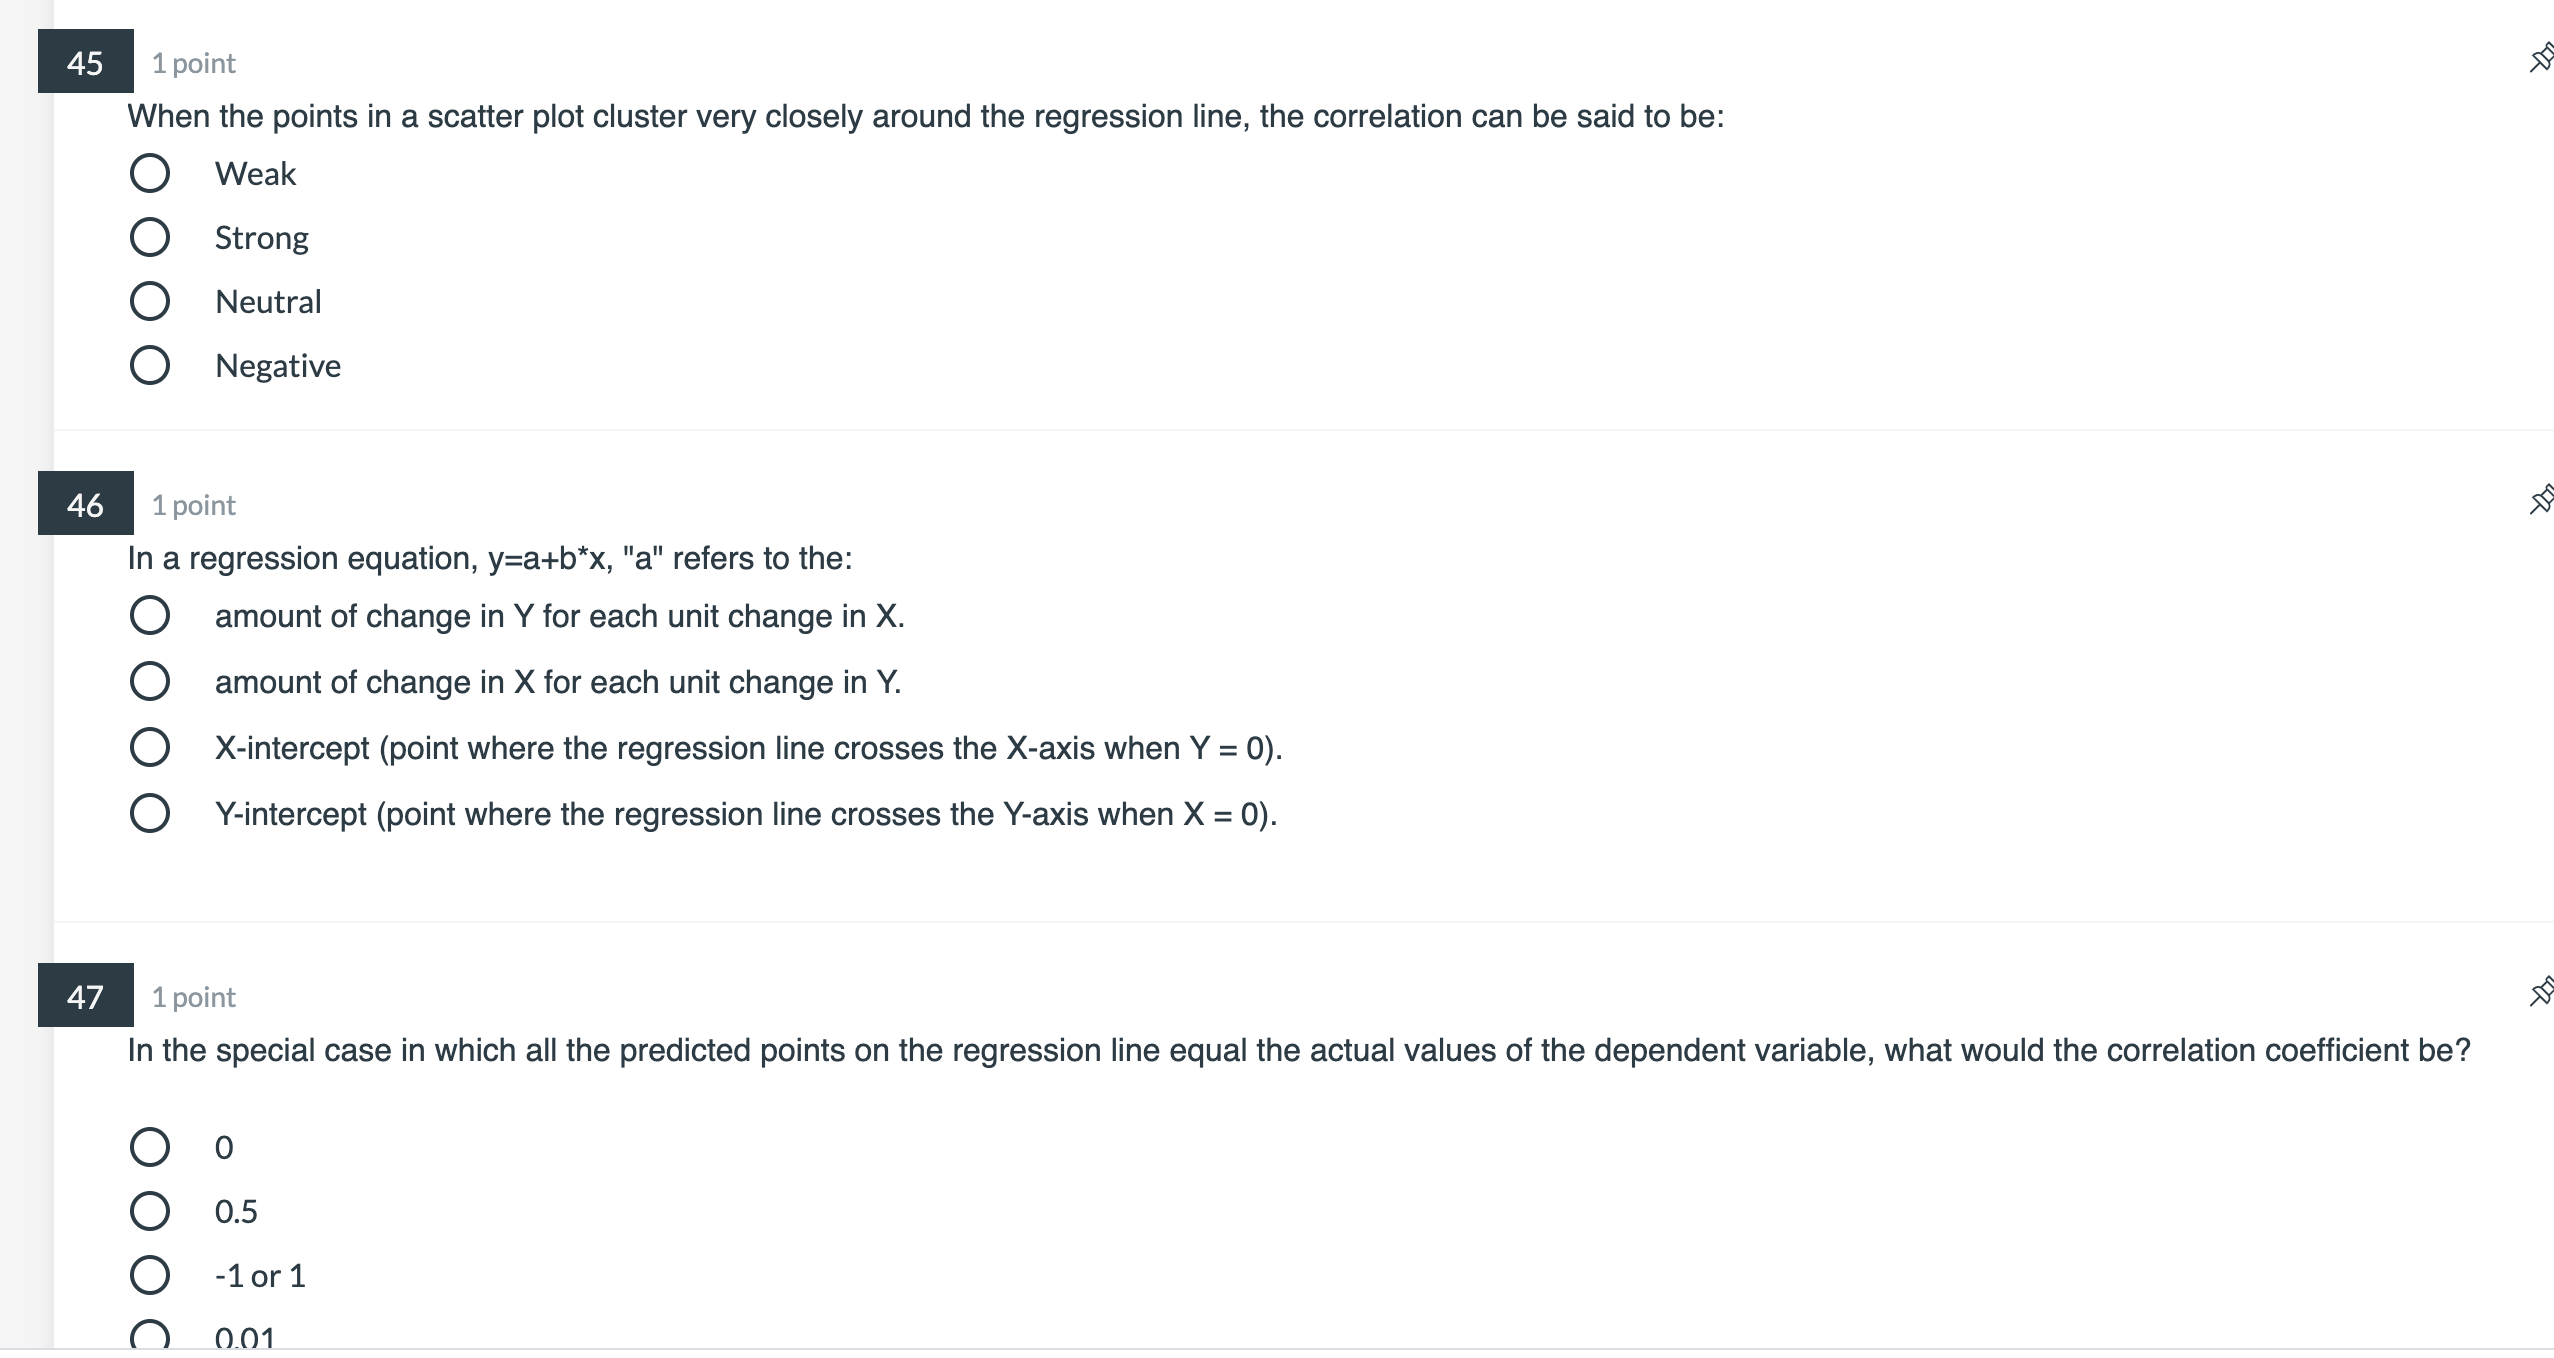
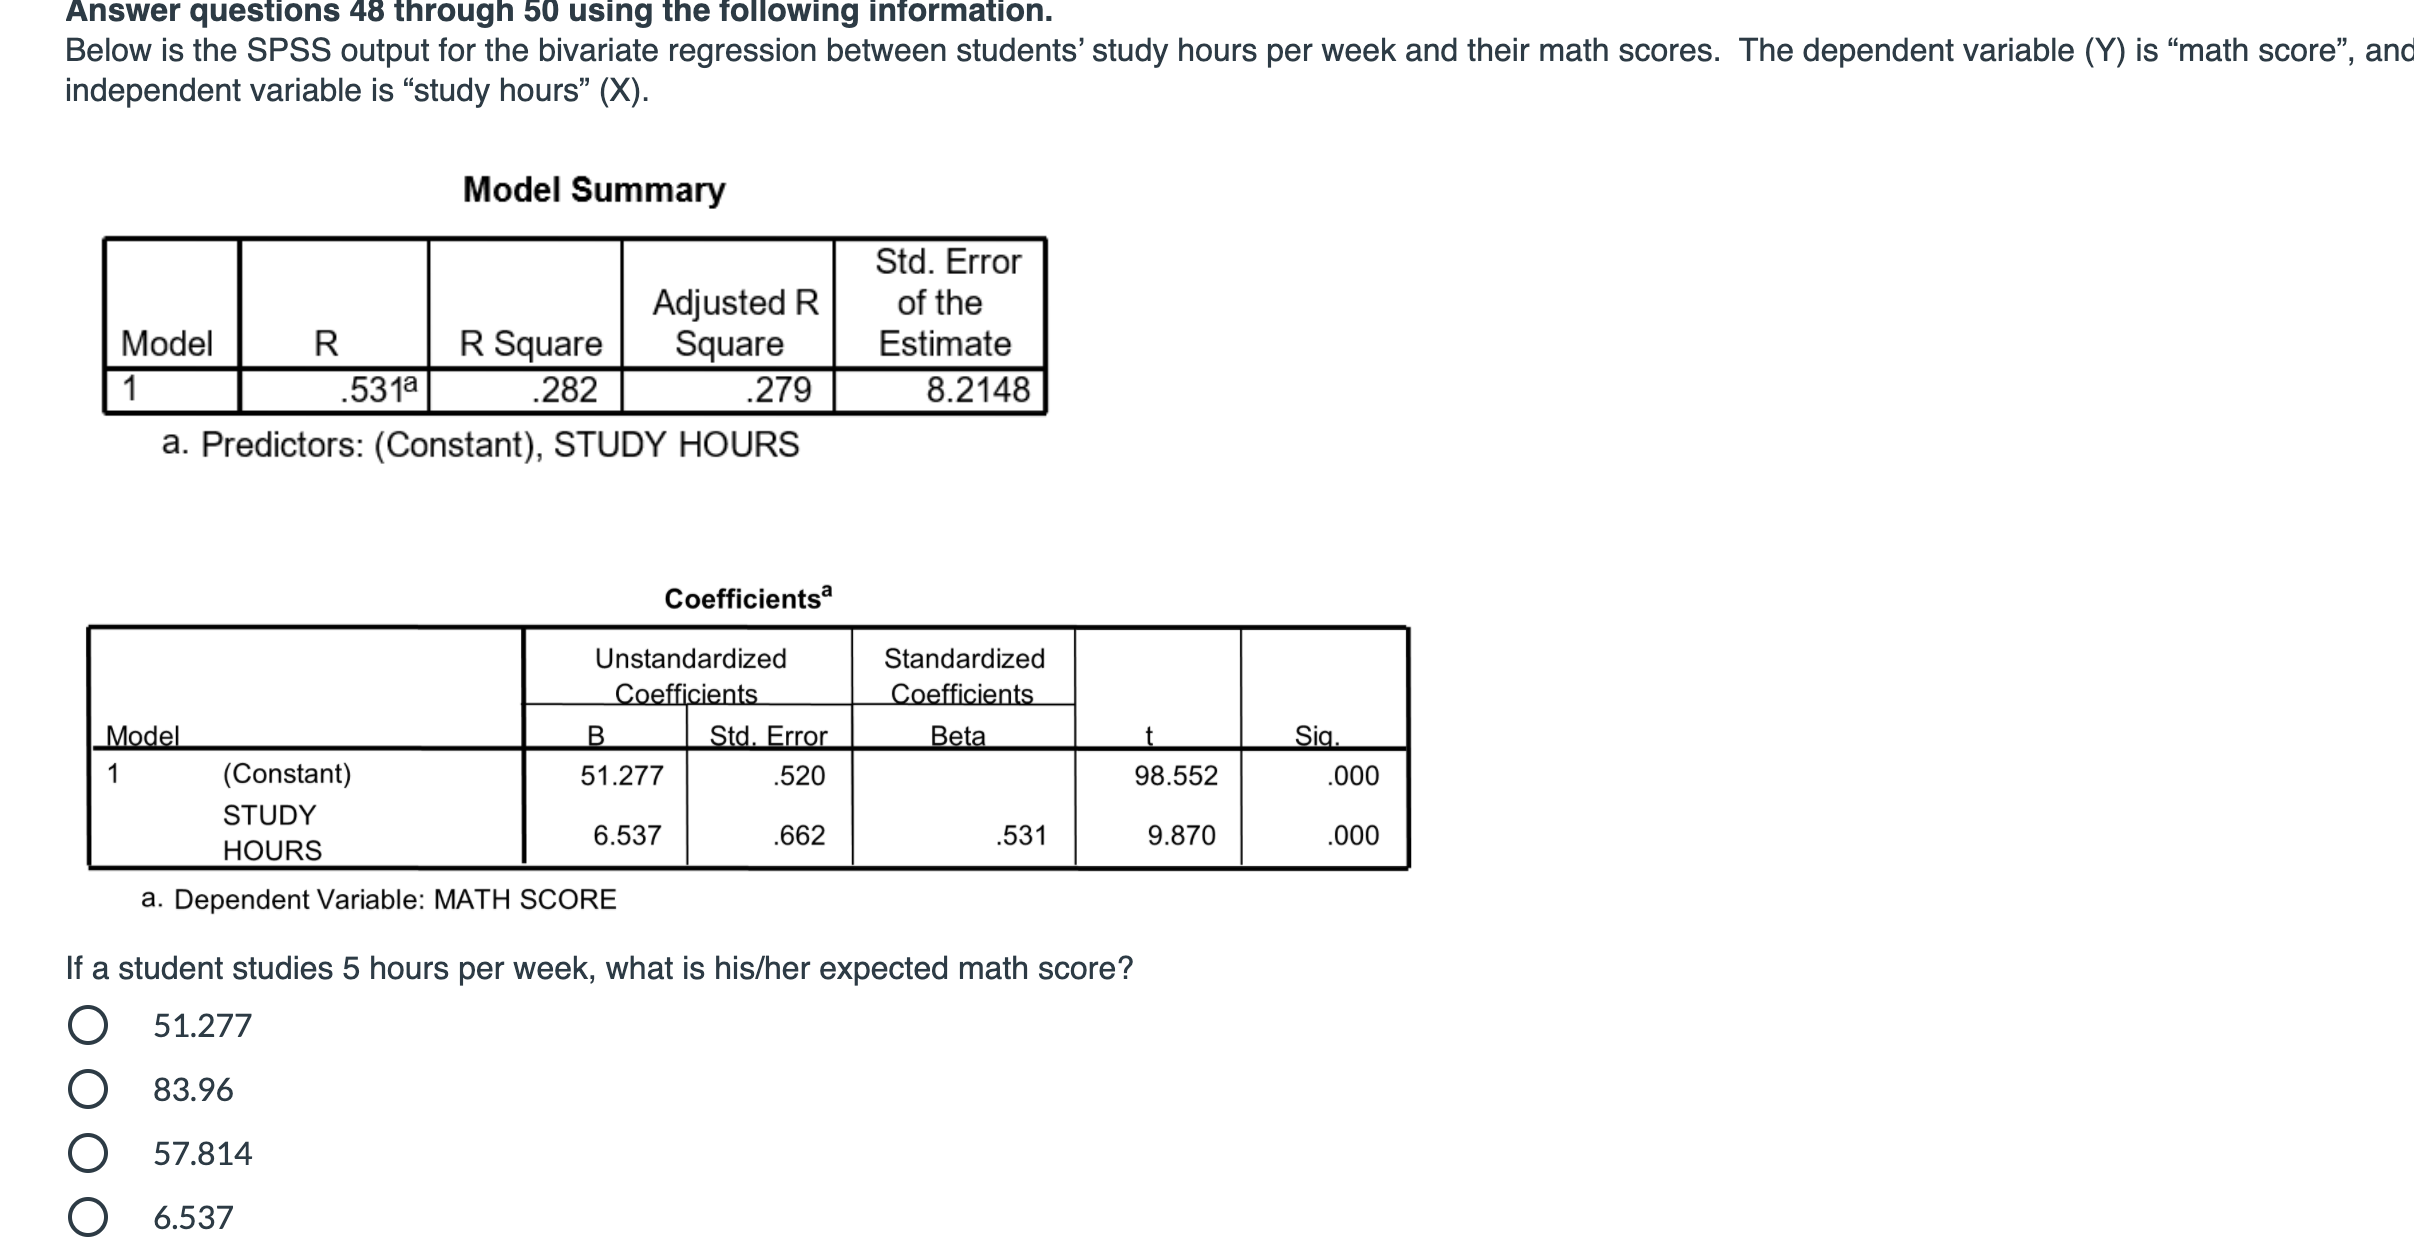
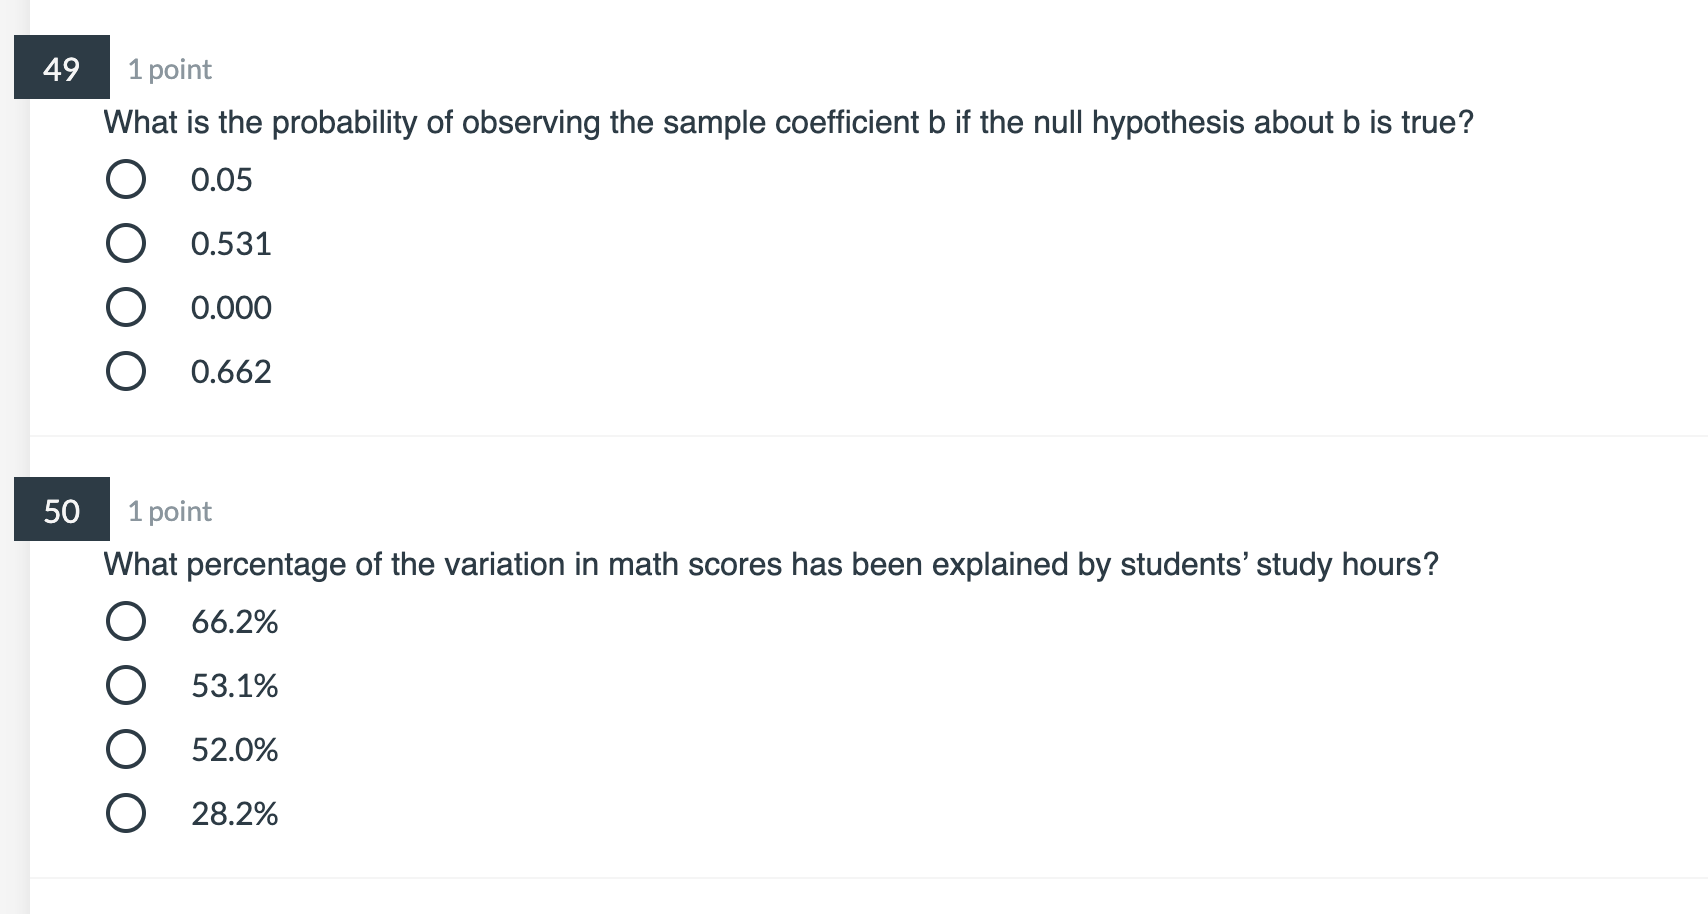
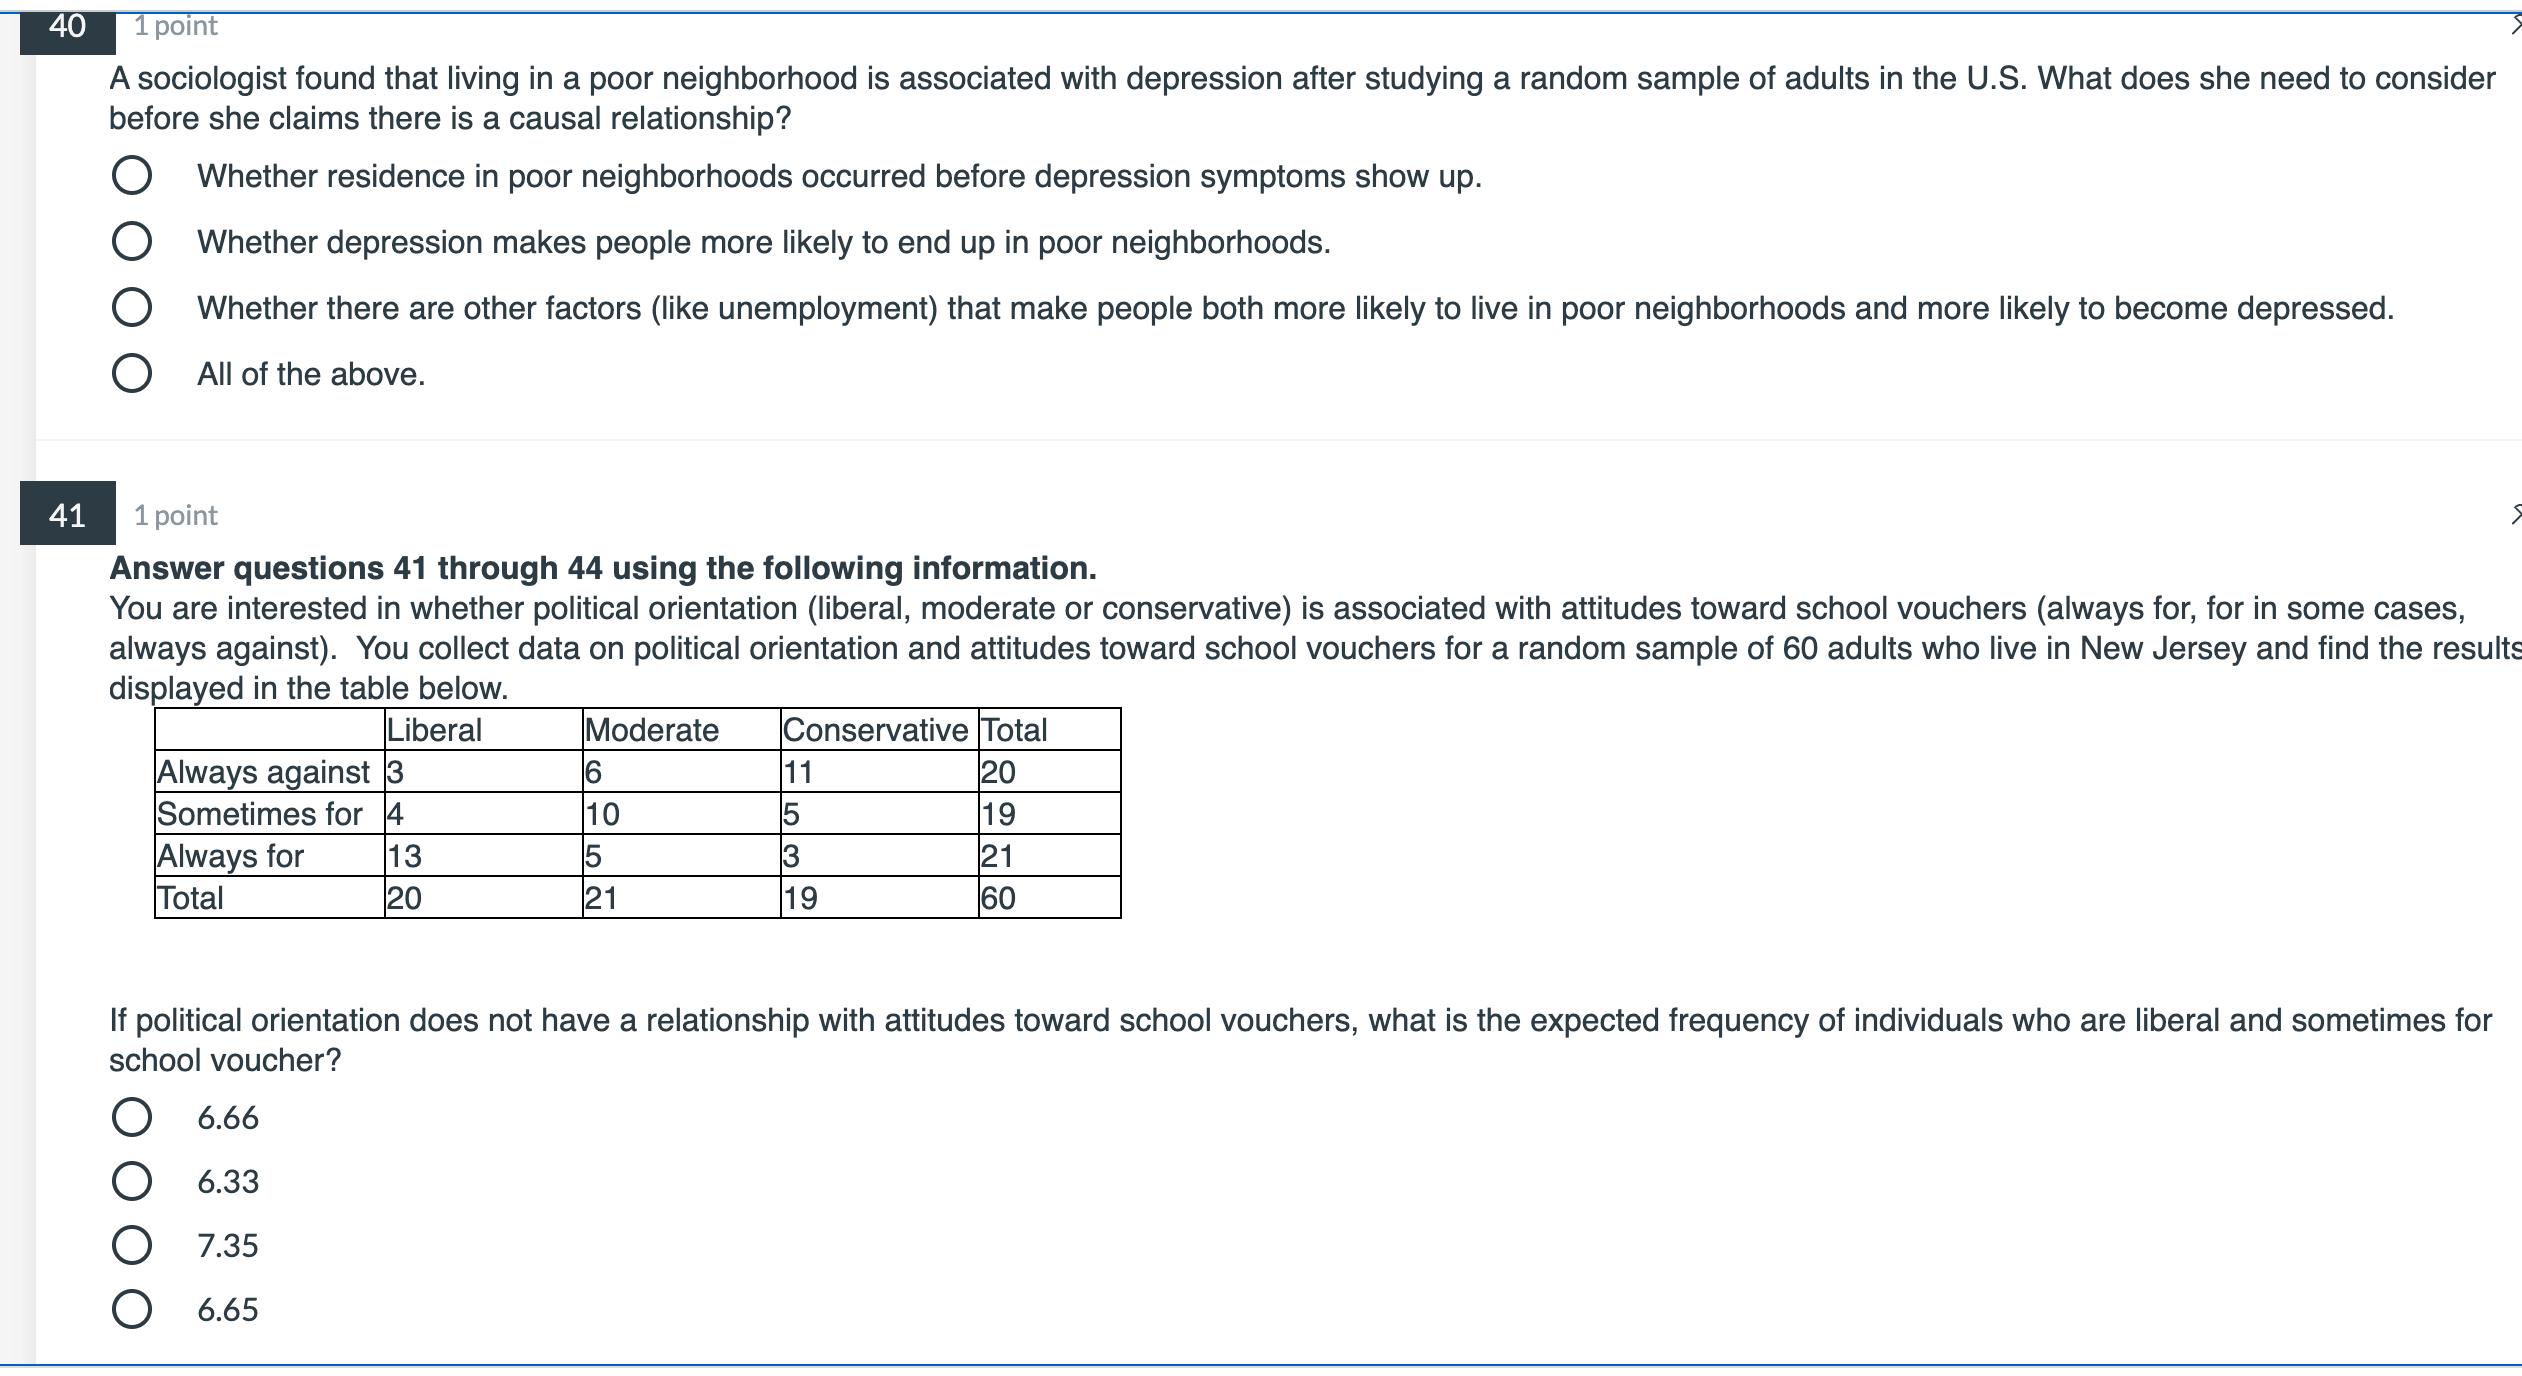
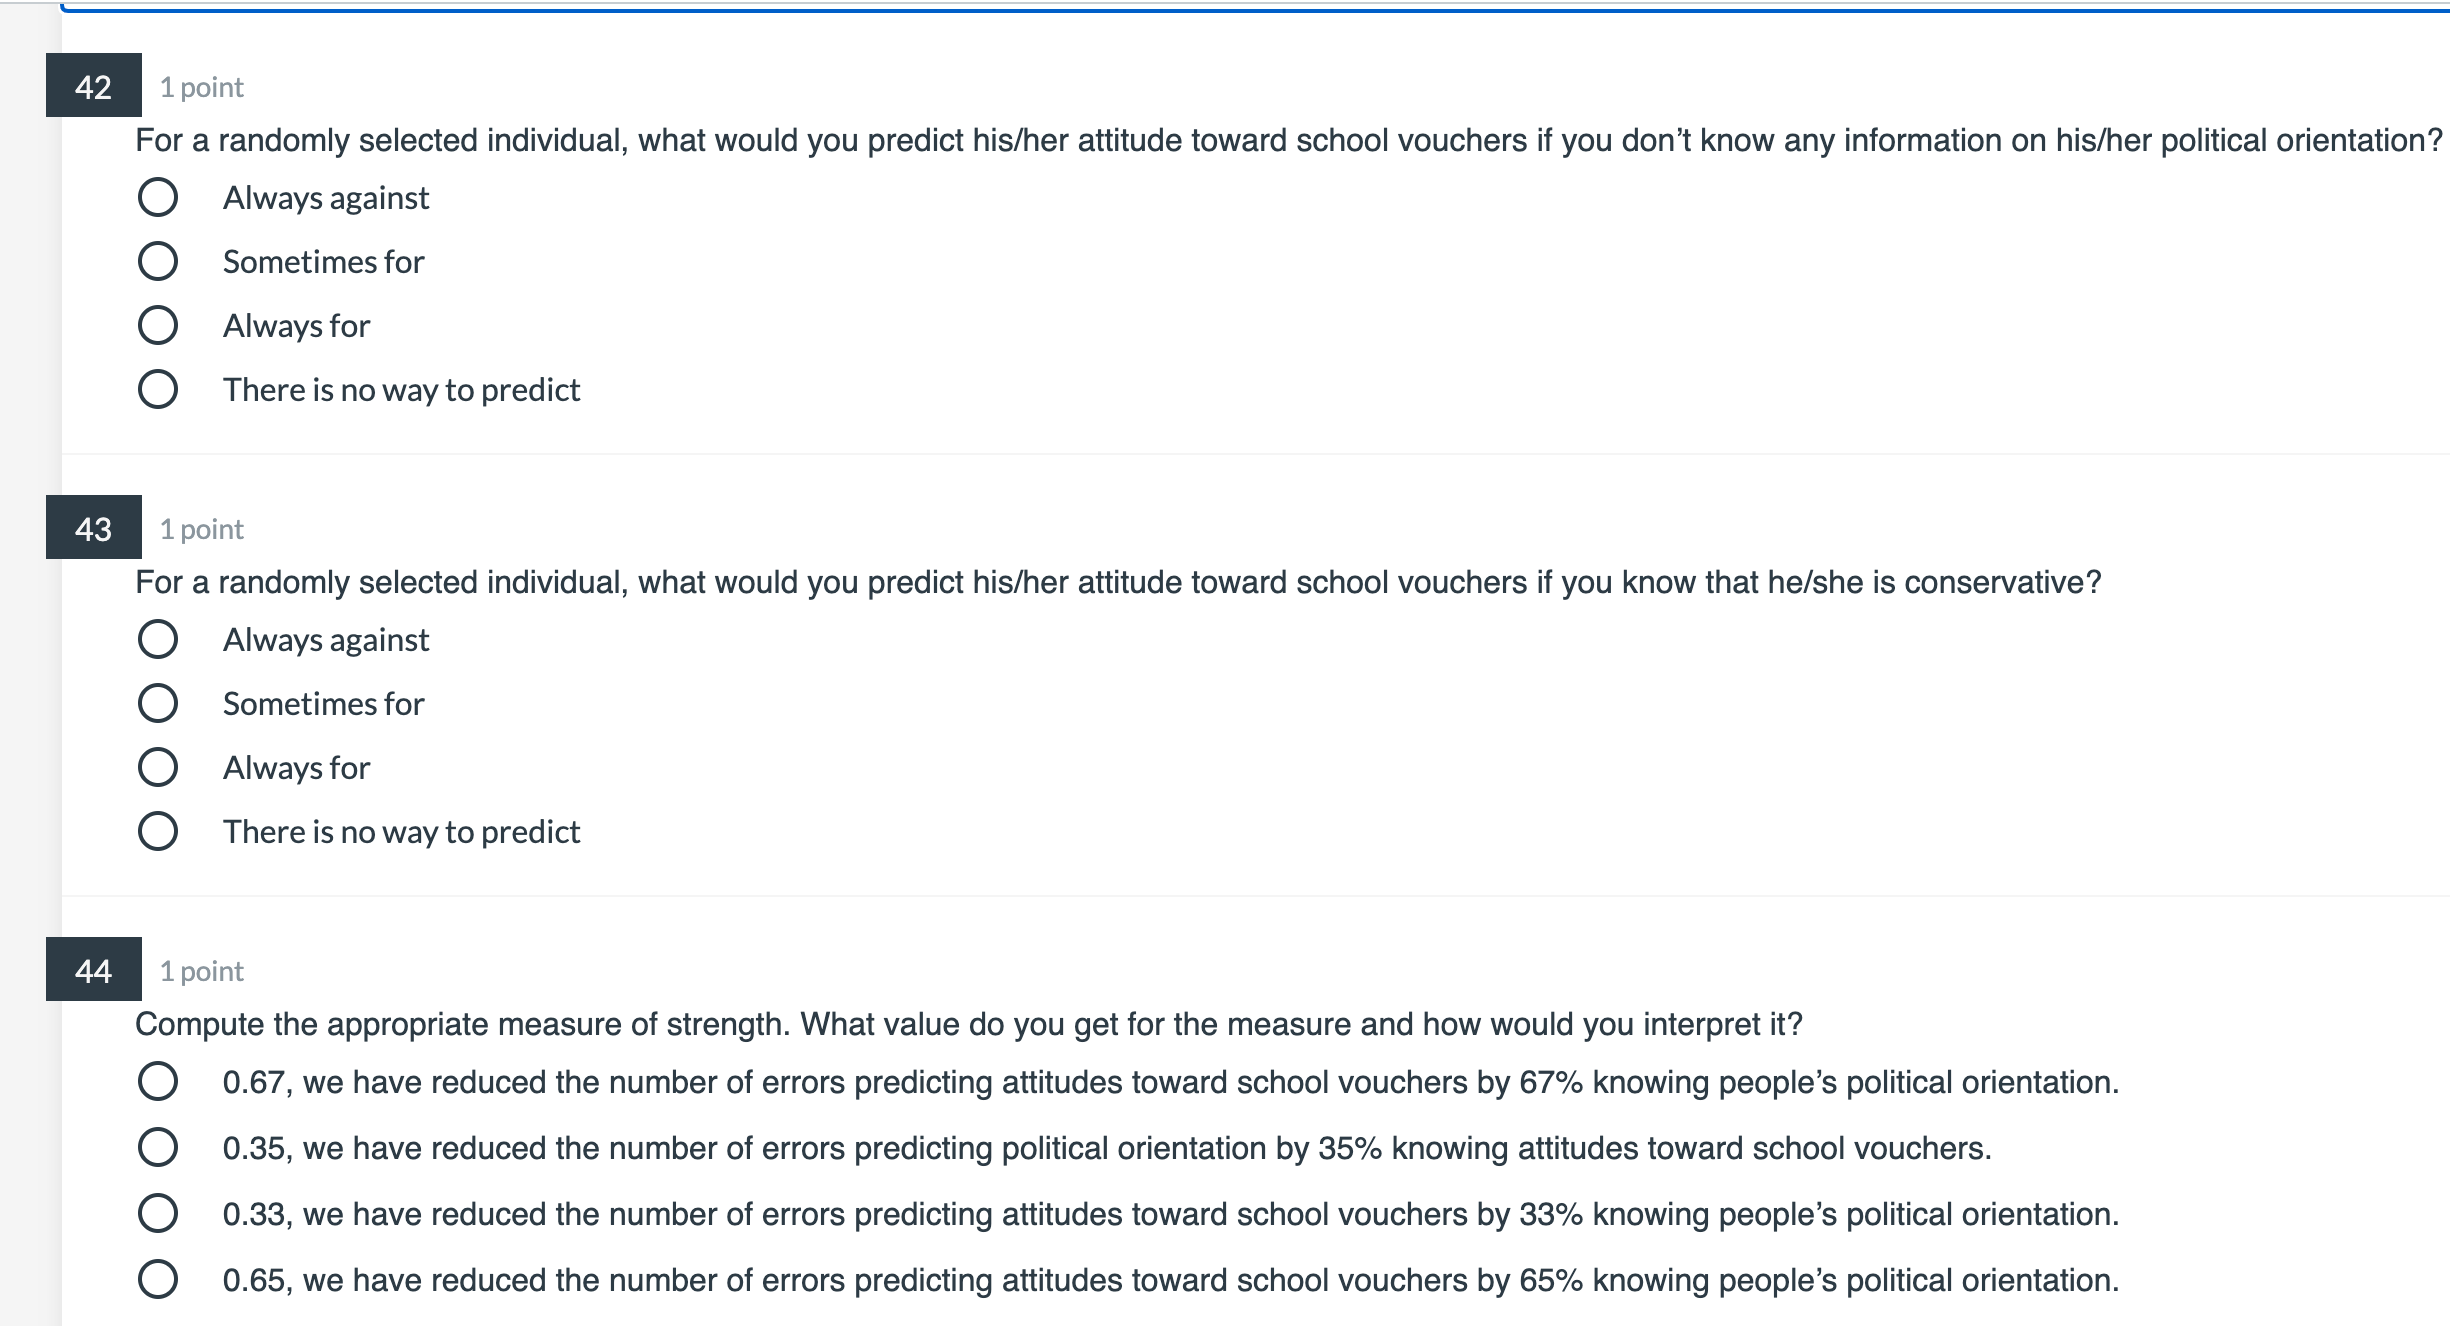
1 point Q Answer questions 36 through 39 based on the following information. As a researcher in the sociology of family you are interested in how the type of residence (dorms, apartments, at home) influences students' emotional closeness to parents. You draw a random sample of 21 students from each type of residence (dorms, apartments, at home) and give them a set of survey questions, so that their closeness to parents is measured on a scale from 0 to 500. From this sample, you obtain the following results. Sum of Squares Between 315 Within 1427 Total 1742 You will perform the appropriate hypothesis test (an F test), at alpha = .01, to determine whether closeness to parents differs across students of the three types of residence. What is the critical value of F? 4.13 5.93 3.15 4.98 0000 1 point What is the sample F you calculated? 0 1.99 O 6 62 O 4 98 What decision do you make regarding the null hypothesis and why? Fail to reject the null hypothesis because it is very likely to observed this sample F when the null hypothesis is true. 0 Fail to reject the null hypothesis because it is very likely to observed this sample F when the alternative hypothesis is true. 0 Reject the null hypothesis because it is very unlikely to observed this sample F when the null hypothesis is true. Reject the null hypothesis because it is very unlikely to observed this sample F when the alternative hypothesis is true. 1 point What is the value of and interpretation for the measure of strength of this relationship? Eta squared is 0.18; 18% of the total variation in emotional closeness to parents is explained by the type of residence. Eta squared is 0.18; 18% of the total variation in the type of residence is explained by emotional closeness to parents. Eta squared is 0.22; 22% of the total variation in emotional closeness to parents is explained by the type of residence. OOOO Eta squared is 0.22; 22% of the total variation in the type of residence is explained by emotional closeness to parents. 40 1 point A sociologist found that living in a poor neighborhood is associated with depression after studying a random sample of adults in the U.S. What does she need to consider before she claims there is a causal relationship? O Whether residence in poor neighborhoods occurred before depression symptoms show up. O Whether depression makes people more likely to end up in poor neighborhoods. O Whether there are other factors (like unemployment) that make people both more likely to live in poor neighborhoods and more likely to become depressed. O All of the above. 41 1 point Answer questions 41 through 44 using the following information. You are interested in whether political orientation (liberal, moderate or conservative) is associated with attitudes toward school vouchers (always for, for in some cases, always against). You collect data on political orientation and attitudes toward school vouchers for a random sample of 60 adults who live in New Jersey and find the result displayed in the table below Liberal Moderate Conservative Total Always against 3 6 11 20 Sometimes for 4 10 5 19 Always for 13 5 3 21 Total 20 21 19 60 If political orientation does not have a relationship with attitudes toward school vouchers, what is the expected frequency of individuals who are liberal and sometimes for school voucher? O 6.66 O 6.33 O 7.35 O 6.651 point For a randomly selected individual, what would you predict his/her attitude toward school vouchers it you don't know any information on his/her political orientation? Always against 0 0 Sometimes for O 0 Always for There is no way to predict 1 point For a randomly selected individual, what would you predict his/her attitude toward school vouchers if you know that he/she is conservative? 0 Always against 0 Sometimes for 0 Always for There is no way to predict 1 point Compute the appropriate measure of strength. What value do you get for the measure and how would you interpret it? 0.67, we have reduced the number of errors predicting attitudes toward school vouchers by 67% knowing people's political orientation. 0.35, we have reduced the number of errors predicting political orientation by 35% knowing attitudes toward school vouchers. 0.33, we have reduced the number of errors predicting attitudes toward school vouchers by 33% knowing people's political orientation. 0000 0.65, we have reduced the number of errors predicting attitudes toward school vouchers by 65% knowing people's political orientation. 1 point When the points in a scatter plot cluster very closely around the regression line. the correlation can be said to be: Weak Strong Neutral 0000 Negative 1 point In a regression equation, y=a+b*x, "a" refers to the: amount of change in Y for each unit change in X. amount of change in X for each unit change in Y. X-intercept (point where the regression line crosses the X-axis when Y = 0). 0000 Y-intercept (point where the regression line crosses the Y-axis when X = 0). 1 point In the special case in which all the predicted points on the regression line equal the actual values of the dependent variable, what would the correlation coefficient be? 00 00.5 0 -1or1 ('3 0.01 Answer questions 48 through 50 using the tollowing information. Below is the SPSS output for the bivariate regression between students' study hours per week and their math scores. The dependent variable (Y) is \"math score", and independent variable is \"study hours" (X). Model Summary Std. Error Adjusted R of the R Square Square Estimate I-_.Zl 82148 a. Predictors: (Constant). STUDY HOURS Coefficientsa Unstandardized Standardized I'I'I l'l 'l (Constant) STUDY HOURS 6. Dependent Variable: MATH SCORE If a student studies 5 hours per week, what is his/her expected math score? 0 51.277 0 83 96 0 57.814 What is the probability of observing the sample coefficient b if the null hypothesis about b is true? 1 point What percentage of the variation in math scores has been explained by students' study hours? 0 66.2% 0 53.1% 0 52.000 0 28.2%
Step by Step Solution
There are 3 Steps involved in it

Get step-by-step solutions from verified subject matter experts