

Question: QUESTIONS - NEED HELP WITH QUESTIONS 4 - 8 PLEASE 1. Why was Dakota's existing pricing system inadequate for its current operating environment? 2. Develop
QUESTIONS - NEED HELP WITH QUESTIONS 4 - 8 PLEASE
1. Why was Dakota's existing pricing system inadequate for its current operating environment?
2. Develop an activity-based cost system for Dakota Office Products (DOP) based on the year 2000 data. Calculate the activity cost-driver rate for each DOP activity in 2000.
3. Using your answer to Question 2, calculate the profitability of Customer A and Customer B.
4. What explains any difference in profitability between the two customers?
5. What are the limitations, if any, to the estimates of the profitability of the two customers?
6. Is there any additional information you would like to have to explain the relative profitability of the two customers?
7. Assume that Dakota applies the analysis done in Question 3 to its entire customer base. How could such information help Dakota managers increase company profits?
8. Suppose that a major customer switched from manually placing all its orders to placing all its orders over the internet site. How should this affect the activity cost-driver rates calculated in Question 2? How would the switch affect Dakota's profitability?
HERE IS MY RESPONSE FOR QUESTIONS 1 - 3
1. )
Dakota Office Products occurs the following problem that resulted into inadequate pricing;
Some problems occurred with the current operating environment include:
Profits only when clients placed large orders for cartons
Real drop of profit when many clients place small orders
Wrong cost determination for individual customers
Wrong cost determination for new services provided by Dakota Office Product
EXPLANATION
Dakota Office Product uses traditional costing system where direct and indirect costs are assigned and allocated to products and services delivered to customers. This is better for companies where production operations are high labor intensive and overhead costs are smaller part of total costs. Thus, Activity Based Costing is going to be better for Dakota Office Products. They will be able to calculate the cost of products and services in accordance to the activities involved and resources consumed. Furthermore, this made some customers much more profitable than others.
2. Activity cost-driver rates: The following are the activity based costing that can be used by Dakota Office Product. The Activity Based Costing method is a way for a company to break up cost into cost pools and allocates it into cost driver. Through this method, Dakota Office Product help them to alleviate the process and give them more extensive view of different how each cost pools are performing. Moreover, Activity Based Costing method help DOP too to analyze the profitability ratio of each customer based on the services they used.
EXPLANATION
Activity One: process cartons in and out of the facility
Rate=(90% of Warehouse Personnel Expense + Cost of Items Purchased)/cartons processed
Rate=(90%*2,400,000+35,000,000)/80,000= $464.5 /per carton
Activity Two: the new desktop delivery service
Rate=(10% of Warehouse Personnel Expense + Delivery Truck Expenses)/desktop deliveries
Rate=(10%*2,400,000+200,000)/2000= $220 /per carton
Activity Three: order handling
Rate= (Warehouse Expenses + Freight)/ number of orders
Rate=(2,000,000+450,000)/(16,000+8,000)=$102.08 /per order
3.
The Profitability of the customer help the company to assess its operation on how well they are performing and generating sales. Dakota Office Product profitability in Customer A has a positive net income compare to Customer B which is negative. This only means that Customer B must reduced some cost in their overhead as this resulted overstated. Moreover, another implication of this profitability was based on the number of cartons used. If you will see that they have same amount of carton shipped while they have different in profitability. Through the use of ABC system it was calculated out that the actual profitability of each customer related to the costs of services that they have.
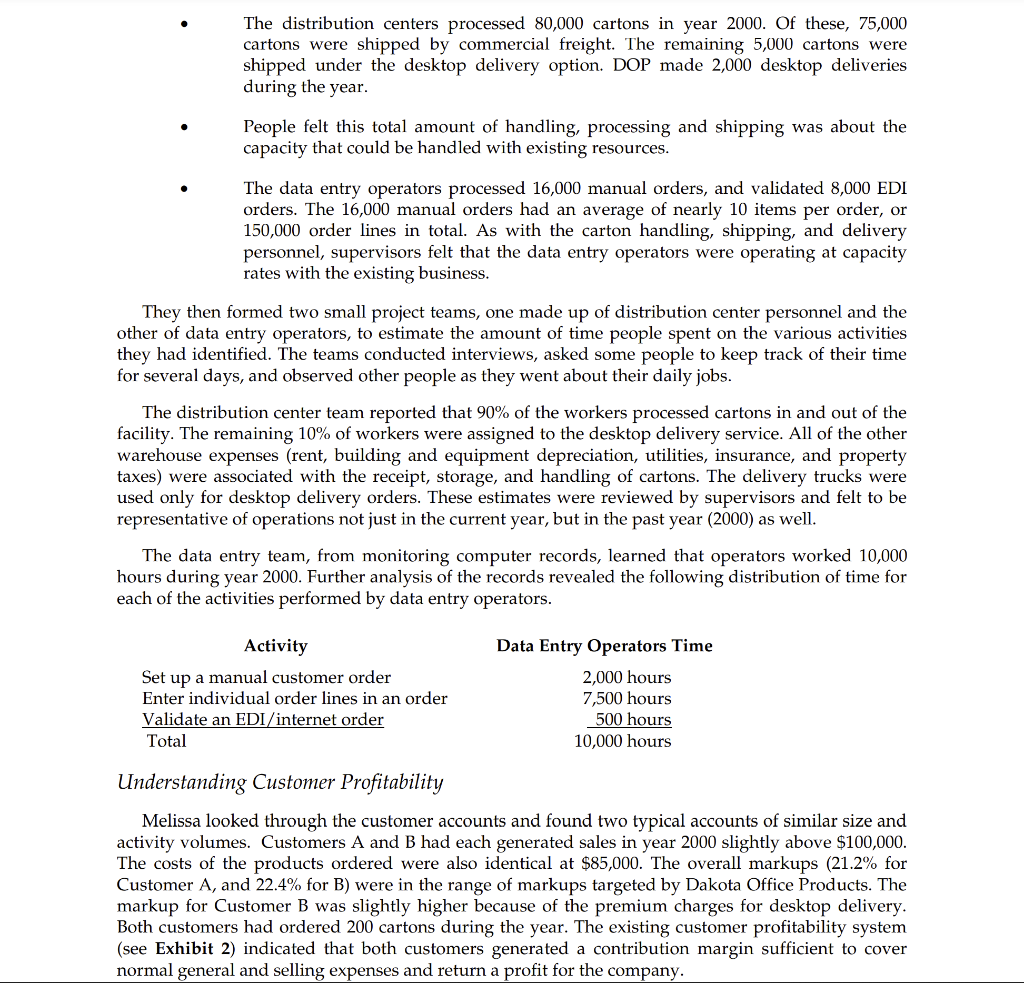
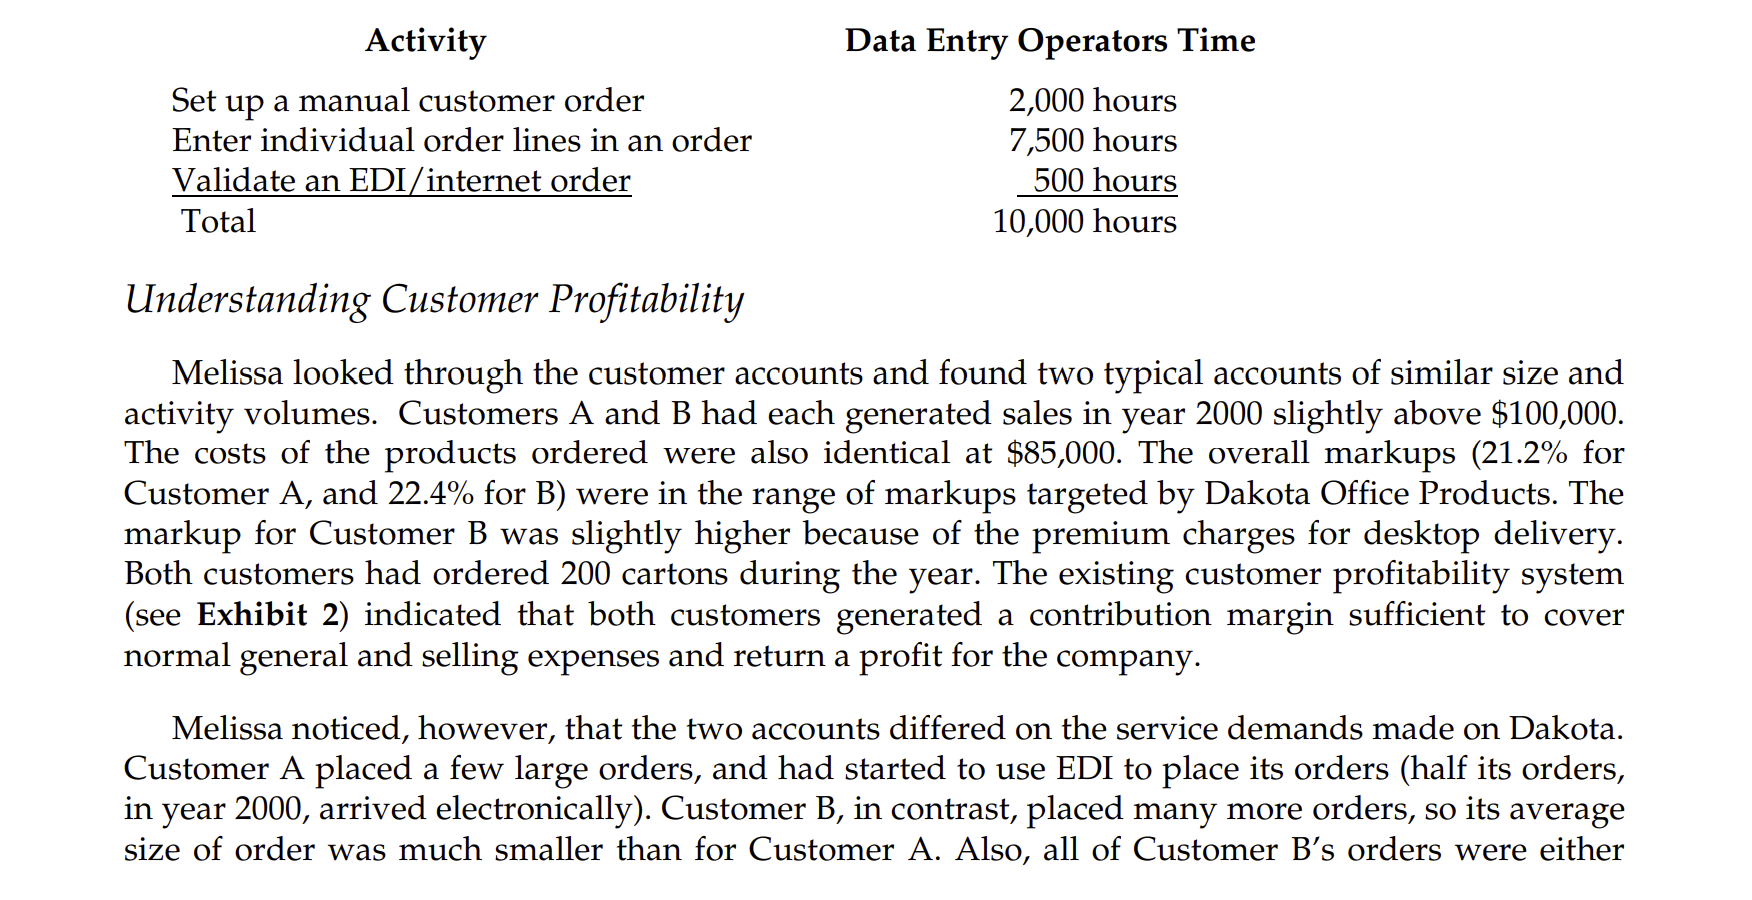
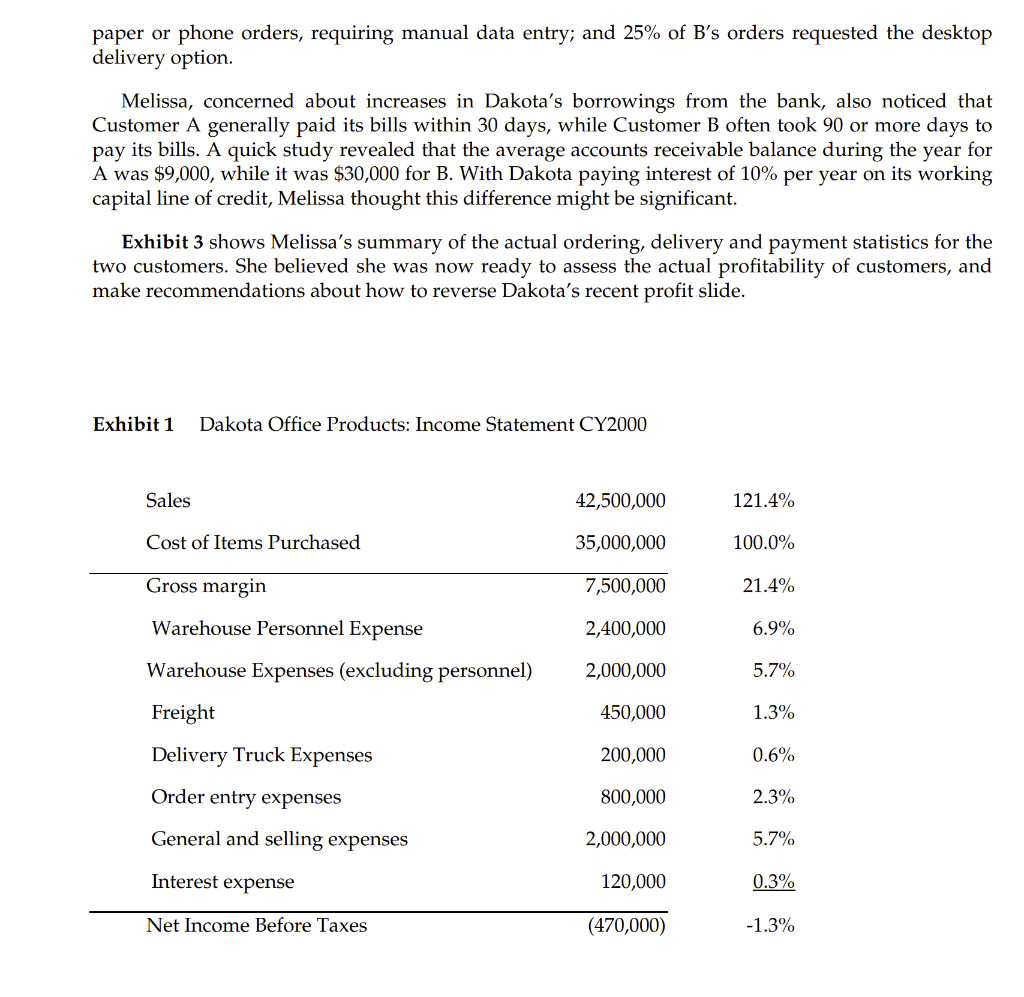
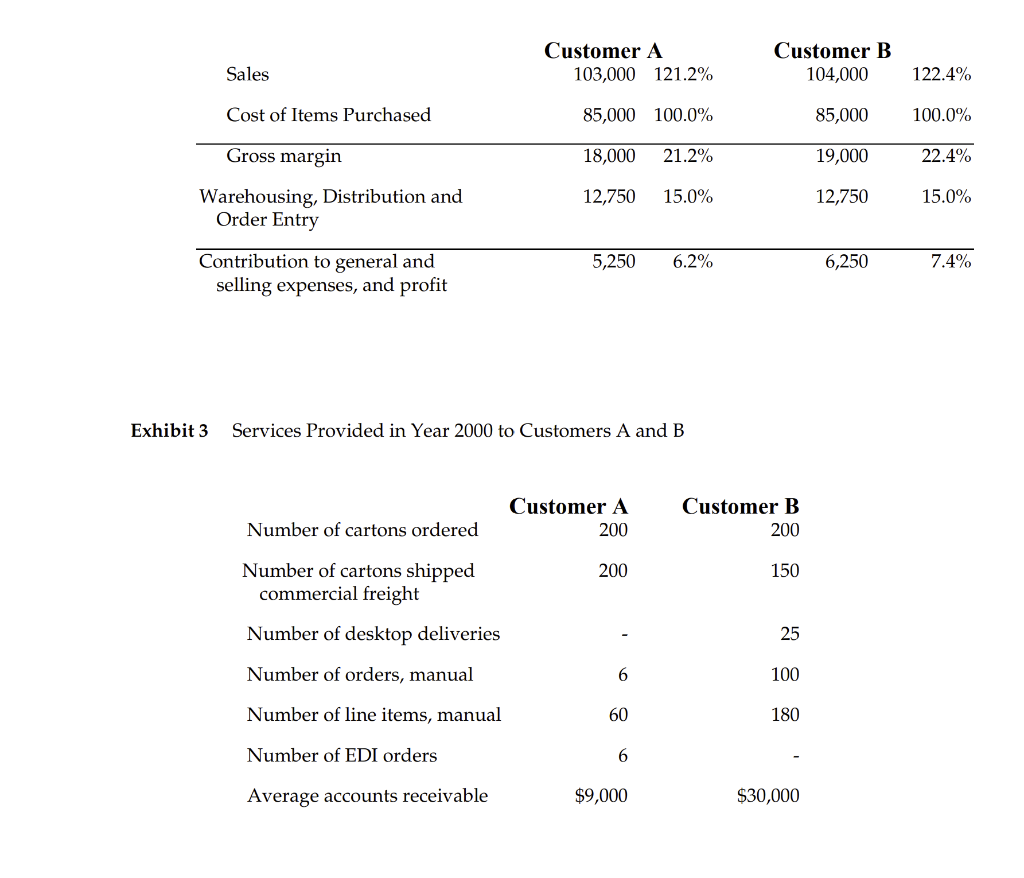
John Malone, General Manager of Dakota Office Products (DOP) was concerned about the financial results for calendar year 2000. Despite a sales increase from the prior year, the company had just suffered the first loss in its history (see summary income statement in Exhibit 1). Dakota Office Products was a regional distributor of office supplies to institutions and commercial businesses. It offered a comprehensive product line ranging from simple writing implements (such as pens, pencils, and markers) and fasteners to specialty paper for modern high-speed copiers and printers. DOP had an excellent reputation for customer service and responsiveness. DOP operated several distribution centers in which personnel unloaded truckload shipments of products from manufacturers, and moved the cartons into designated storage locations until customers requested the items. Each day, after customer orders had been received, DOP personnel drove forklift trucks around the warehouse to accumulate the cartons of items and prepared them for shipment. Typically, DOP shipped products to its customers using commercial truckers. Recently, DOP had attracted new business by offering a "desk top" option by delivering the packages of supplies directly to individual locations at the customer's site. Dakota operated a small fleet of trucks and assigned warehouse personnel as drivers to make the desktop deliveries. Dakota charged a small price premium (up to an additional 2\% markup) for the convenience and savings such direct delivery orders provided to customers. The company believed that the added price for this service could improve margins in its highly competitive office supplies distribution business. DOP ordered supplies from many different manufacturers. It priced products to its end-use customers by first marking up the purchased product cost by about 15% to cover the cost of warehousing, distribution, and freight. Then it added another markup to cover the approximate cost for general and selling expenses, plus an allowance for profit. The markups were determined at the start of each year, based on actual expenses in prior years and general industry and competitive trends. Actual prices to customers were adjusted based on long-term relationships and competitive situations, but were generally independent of the specific level of service provided to that customer, except for desk top deliveries. Dakota had introduced electronic data interchange (EDI) in 1999, and a new internet site in 2000, which allowed customer orders to arrive automatically so that clerks would not have to enter customer and order data manually. Several customers had switched to this electronic service because of the convenience to them. Yet Dakota's costs continued to rise. Malone was concerned that even after introducing innovations such as desktop delivery and electronic order entry, the company could not earn a profit. He wondered about what actions he should take to regain profitability. Distribution Center: Activity Analysis Malone turned to his controller, Melissa Dunhill and director of operations, Tim Cunningham for help. Tim suggested: If we can figure out, without going overboard of course, what exactly goes on in the distribution centers, maybe we can get a clearer picture about what it costs to serve our various customers. Melissa and Tim went into the field to get more specific information. They visited one of Dakota's distribution facilities. Site manager Wilbur Smith confirmed, "All we do is store the cartons, process the orders, and ship them to customers." With Wilbur's help, Melissa and Tim identified four primary activities done at the distribution center-process cartons in and out of the facility, the new desk top delivery service, order handling, and data entry. Wilbur described some details of these activities. The amount of warehouse space we need and the people to move cartons in and out of storage and get them ready for shipment just depends on the number of cartons. All items have about the same inventory turnover so space and handling costs are proportional to the number of cartons that go through the facility. We use commercial freight for normal shipments, and the cost is based more on volume than on anything else. Each carton we ship costs about the same, regardless of the weight or distance. Of course, any carton that we deliver ourselves, through our new desktop delivery service, avoids the commercial shipping charges. The team confirmed the information with the warehouse supervisor who noted. This desktop delivery is a real pain for my people. Sure, we offer the service, and it's attracted increased business. But I have had to add people since existing personnel already had more than enough to do. Melissa and Tim next checked on the expenses of entering and validating customer order data. The order entry expenses included the data processing system and the data entry operators. They spoke with Hazel Nutley, a data entry operator at Dakota for 17 years. All I do is key in the orders, line by line by line. I start by entering the customer ID and validating our customer information. Beyond that, the only thing that really matters is how many lines I have to enter. Each line item on the order has to be entered separately. Of course, any order that comes in through our new EDI system or internet page sets up automatically without any intervention from me. I just do a quick check to make sure the customer hasn't made an obvious error, and that everything looks correct. This validity check takes about the same time for all electronic orders; it doesn't depend on the number of items ordered. - The distribution centers processed 80,000 cartons in year 2000. Of these, 75,000 cartons were shipped by commercial freight. The remaining 5,000 cartons were shipped under the desktop delivery option. DOP made 2,000 desktop deliveries during the year. - People felt this total amount of handling, processing and shipping was about the capacity that could be handled with existing resources. - The data entry operators processed 16,000 manual orders, and validated 8,000 EDI orders. The 16,000 manual orders had an average of nearly 10 items per order, or 150,000 order lines in total. As with the carton handling, shipping, and delivery personnel, supervisors felt that the data entry operators were operating at capacity rates with the existing business. They then formed two small project teams, one made up of distribution center personnel and the other of data entry operators, to estimate the amount of time people spent on the various activities they had identified. The teams conducted interviews, asked some people to keep track of their time for several days, and observed other people as they went about their daily jobs. The distribution center team reported that 90% of the workers processed cartons in and out of the facility. The remaining 10% of workers were assigned to the desktop delivery service. All of the other warehouse expenses (rent, building and equipment depreciation, utilities, insurance, and property taxes) were associated with the receipt, storage, and handling of cartons. The delivery trucks were used only for desktop delivery orders. These estimates were reviewed by supervisors and felt to be representative of operations not just in the current year, but in the past year (2000) as well. The data entry team, from monitoring computer records, learned that operators worked 10,000 hours during year 2000. Further analysis of the records revealed the following distribution of time for each of the activities performed by data entry operators. Understanding Customer Profitability Melissa looked through the customer accounts and found two typical accounts of similar size and activity volumes. Customers A and B had each generated sales in year 2000 slightly above $100,000. The costs of the products ordered were also identical at $85,000. The overall markups (21.2% for Customer A, and 22.4% for B) were in the range of markups targeted by Dakota Office Products. The markup for Customer B was slightly higher because of the premium charges for desktop delivery. Both customers had ordered 200 cartons during the year. The existing customer profitability system (see Exhibit 2) indicated that both customers generated a contribution margin sufficient to cover normal general and selling expenses and return a profit for the company. Understanding Customer Profitability Melissa looked through the customer accounts and found two typical accounts of similar size and activity volumes. Customers A and B had each generated sales in year 2000 slightly above $100,000. The costs of the products ordered were also identical at $85,000. The overall markups (21.2% for Customer A, and 22.4% for B) were in the range of markups targeted by Dakota Office Products. The markup for Customer B was slightly higher because of the premium charges for desktop delivery. Both customers had ordered 200 cartons during the year. The existing customer profitability system (see Exhibit 2) indicated that both customers generated a contribution margin sufficient to cover normal general and selling expenses and return a profit for the company. Melissa noticed, however, that the two accounts differed on the service demands made on Dakota. Customer A placed a few large orders, and had started to use EDI to place its orders (half its orders, in year 2000, arrived electronically). Customer B, in contrast, placed many more orders, so its average size of order was much smaller than for Customer A. Also, all of Customer B's orders were either paper or phone orders, requiring manual data entry; and 25% of B s orders requested the desktop delivery option. Melissa, concerned about increases in Dakota's borrowings from the bank, also noticed that Customer A generally paid its bills within 30 days, while Customer B often took 90 or more days to pay its bills. A quick study revealed that the average accounts receivable balance during the year for A was $9,000, while it was $30,000 for B. With Dakota paying interest of 10% per year on its working capital line of credit, Melissa thought this difference might be significant. Exhibit 3 shows Melissa's summary of the actual ordering, delivery and payment statistics for the two customers. She believed she was now ready to assess the actual profitability of customers, and make recommendations about how to reverse Dakota's recent profit slide. Exhibit 1 Dakota Office Products: Income Statement CY2000 Exhibit 3 Services Provided in Year 2000 to Customers A and B
Step by Step Solution
There are 3 Steps involved in it

Get step-by-step solutions from verified subject matter experts