

Question: Questions Responses What does this visualization show? How might these observations affect our risk assessment? How would a red X affect our risk assessment? Visualization
| Questions | Responses |
| What does this visualization show? |
|
| How might these observations affect our risk assessment? |
|
| How would a red X affect our risk assessment? |
|
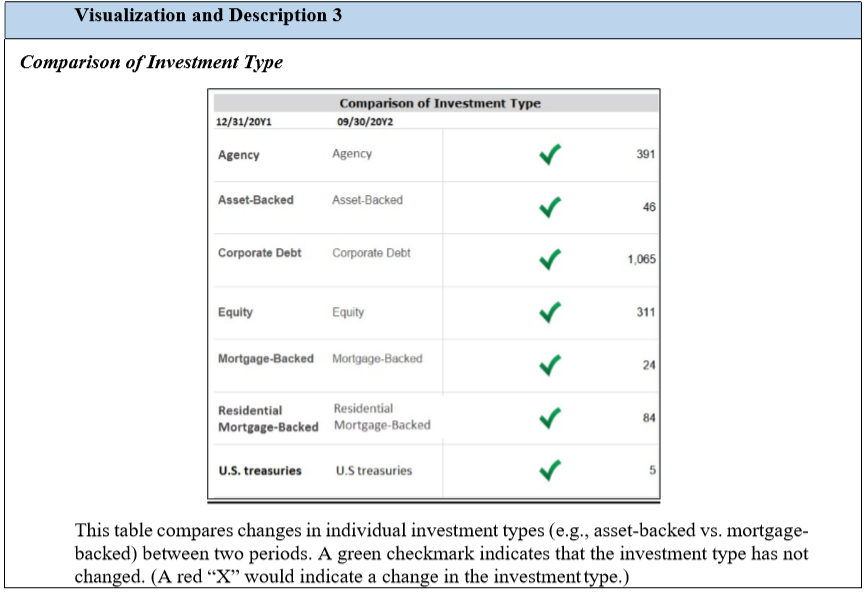
Visualization and Description 3 Comparison of Investment Type Comparison of Investment Type 09/30/2012 12/31/2011 Agency Agency 391 Asset-Backed Asset-Backed 46 Corporate Debt Corporate Debt 1,065 Equity Equity 311 Mortgage-Backed Mortgage-Backed 24 Residential Residential Mortgage-Backed Mortgage-Backed 84 U.S. treasuries U.S treasures 5 This table compares changes in individual investment types (e.g., asset-backed vs. mortgage- backed) between two periods. A green checkmark indicates that the investment type has not changed. (A red X would indicate a change in the investment type.)
Step by Step Solution
There are 3 Steps involved in it

Get step-by-step solutions from verified subject matter experts