

Question: Questions which require graphical solutions, please use Excel and submit Tables and Graphs with your 1.) Three mutually exclusive alternatives are being considered: B Initial
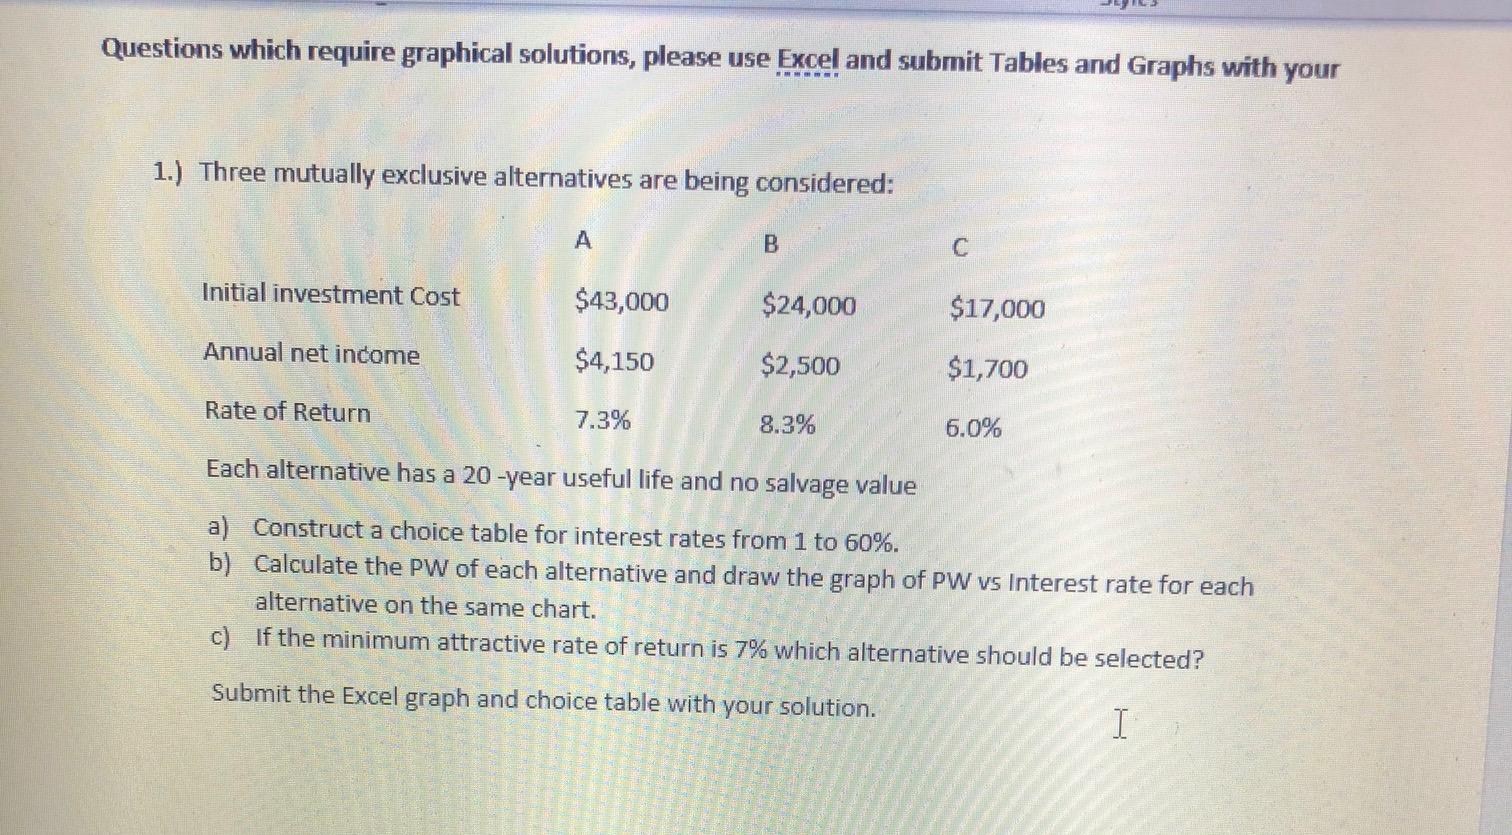
Questions which require graphical solutions, please use Excel and submit Tables and Graphs with your 1.) Three mutually exclusive alternatives are being considered: B Initial investment Cost $43,000 $24,000 $17,000 Annual net income $4,150 $2,500 $1,700 Rate of Return 7.3% 8.3% 6.0% Each alternative has a 20-year useful life and no salvage value a) Construct a choice table for interest rates from 1 to 60%. b) Calculate the PW of each alternative and draw the graph of PW vs Interest rate for each alternative on the same chart. c) If the minimum attractive rate of return is 7% which alternative should be selected? Submit the Excel graph and choice table with your solution. I Questions which require graphical solutions, please use Excel and submit Tables and Graphs with your 1.) Three mutually exclusive alternatives are being considered: B Initial investment Cost $43,000 $24,000 $17,000 Annual net income $4,150 $2,500 $1,700 Rate of Return 7.3% 8.3% 6.0% Each alternative has a 20-year useful life and no salvage value a) Construct a choice table for interest rates from 1 to 60%. b) Calculate the PW of each alternative and draw the graph of PW vs Interest rate for each alternative on the same chart. c) If the minimum attractive rate of return is 7% which alternative should be selected? Submit the Excel graph and choice table with your solution
Step by Step Solution
There are 3 Steps involved in it

Get step-by-step solutions from verified subject matter experts