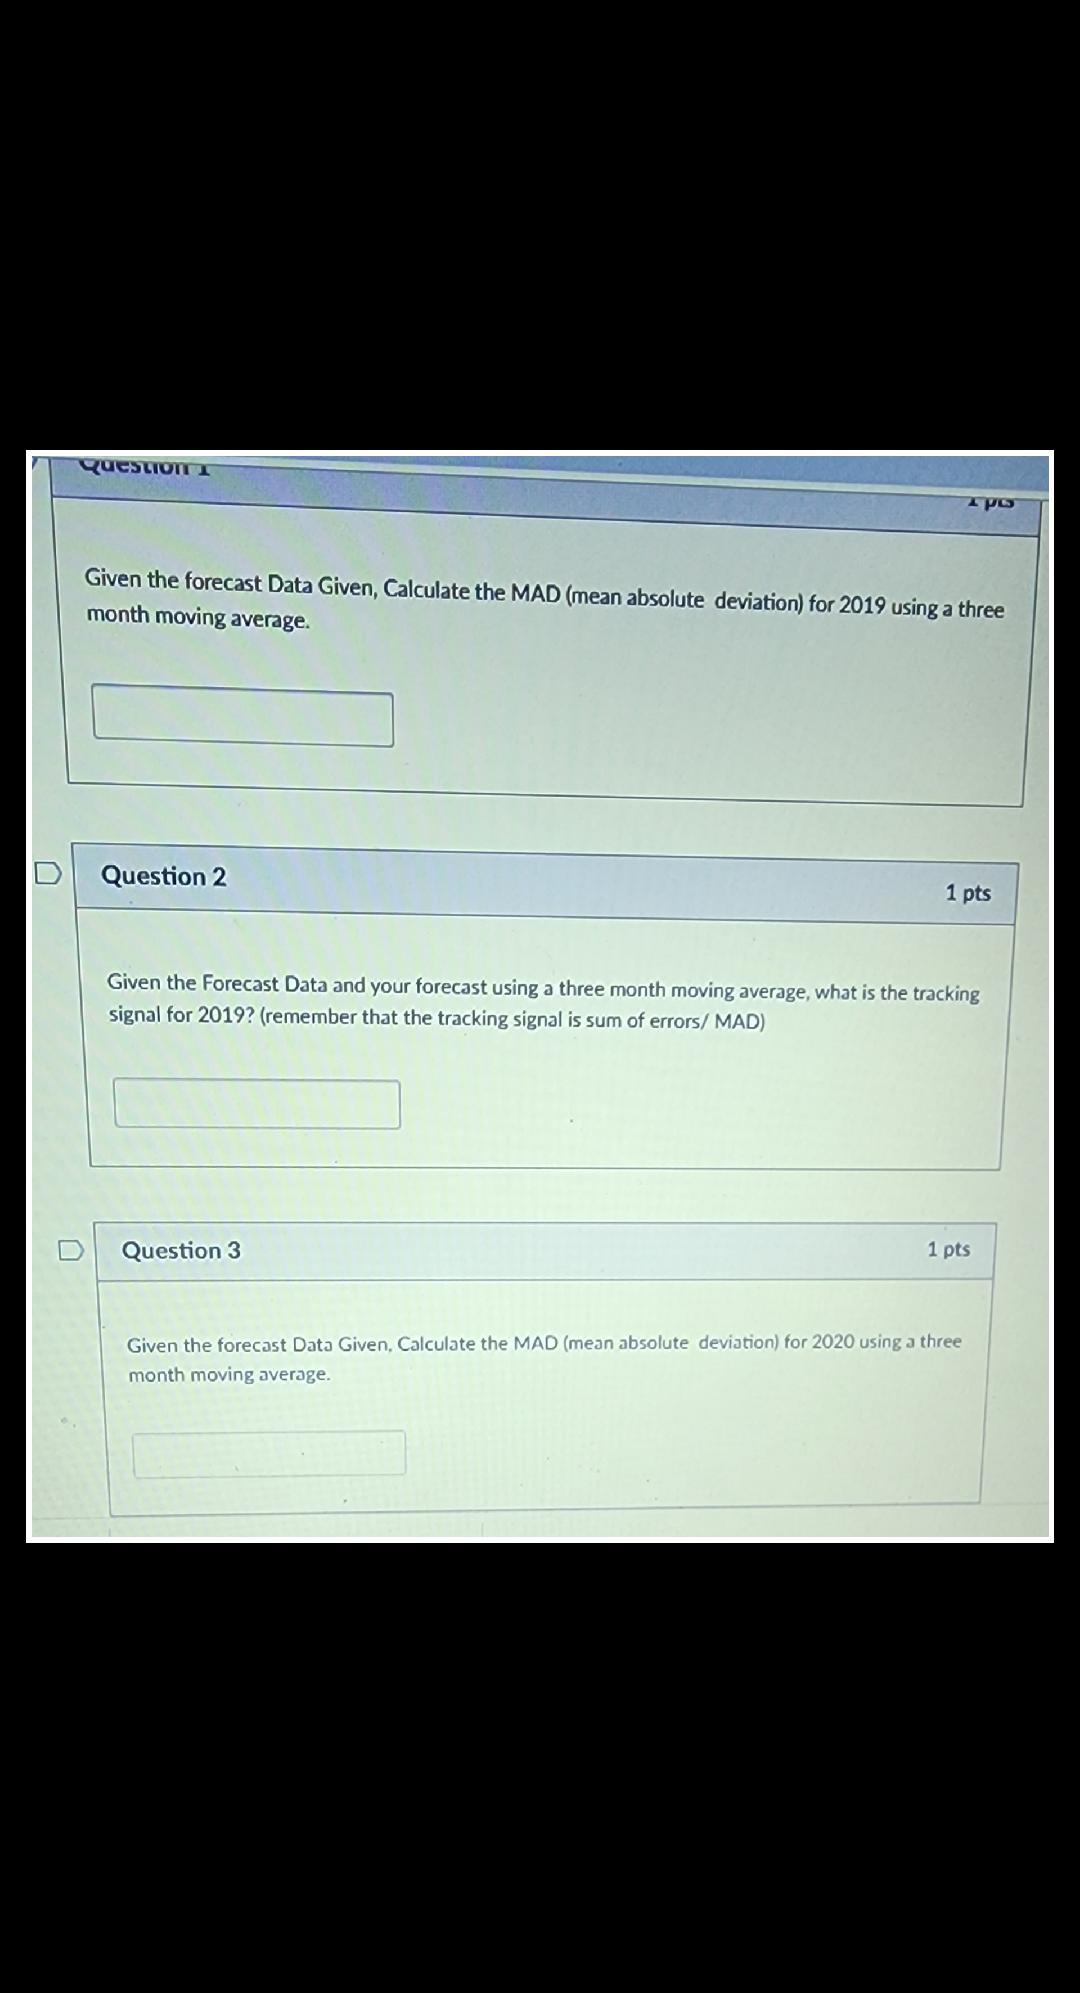
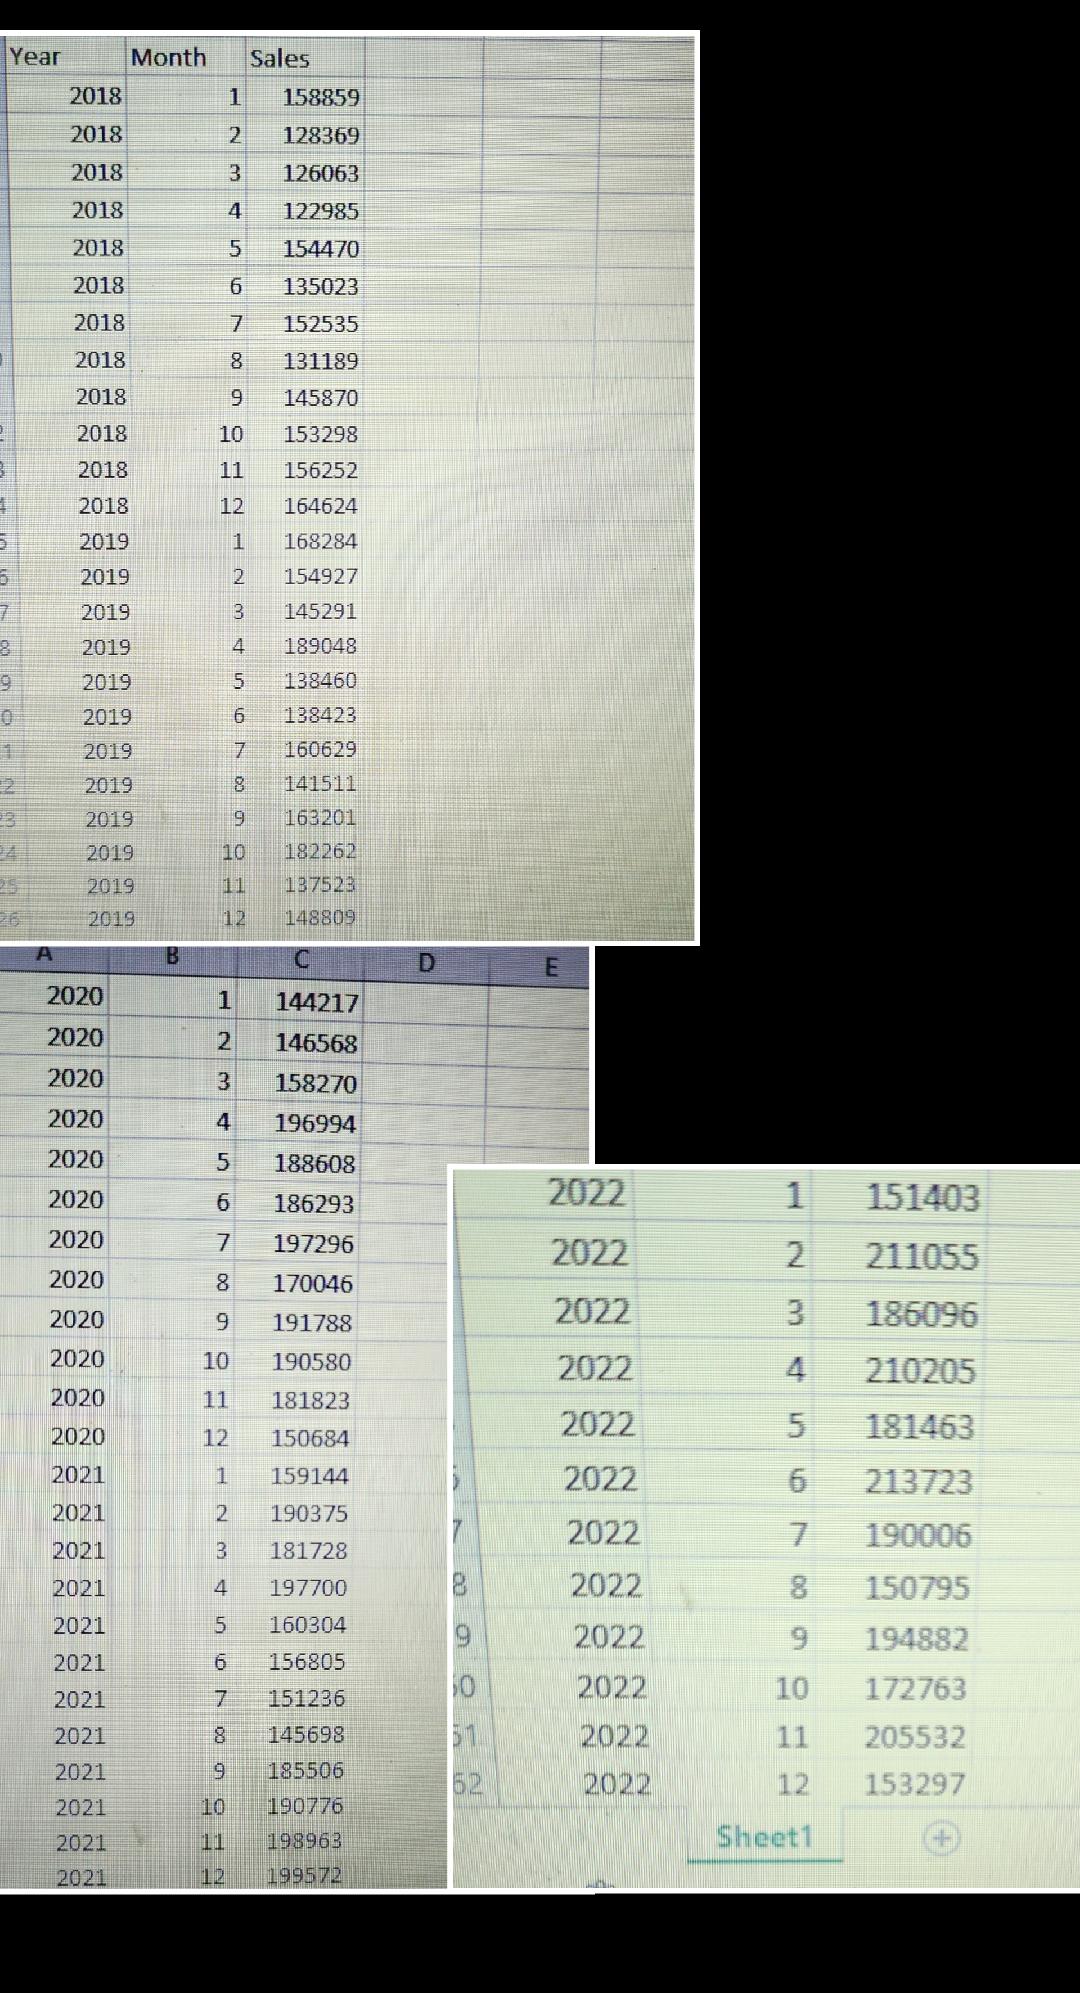
Question: questionT Given the forecast Data Given, Calculate the MAD (mean absolute deviation) for 2019 using a three month moving average. D Question 2 1 pts

questionT Given the forecast Data Given,questionT Given the forecast Data Given,
questionT Given the forecast Data Given, Calculate the MAD (mean absolute deviation) for 2019 using a three month moving average. D Question 2 1 pts Given the Forecast Data and your forecast using a three month moving average, what is the tracking signal for 2019? (remember that the tracking signal is sum of errors/ MAD) D Question 3 1 pts Given the forecast Data Given, Calculate the MAD (mean absolute deviation) for 2020 using a three month moving average.Year Month Sales 2018 158859 2018 2 128369 2018 126063 2018 122985 2018 5 154470 2018 6 135023 2018 7 152535 2018 8 131189 2018 9 145870 2018 10 153298 2018 11 156252 2018 12 164624 2019 1 168284 2019 2 154927 2019 3 145291 2019 4 189048 2019 5 138460 2019 6 138423 2019 160629 2019 8 141511 2019 163201 2019 10 182262 2019 11 187523 2019 12 148809 A B D E 2020 144217 2020 2 146568 2020 3 158270 2020 4 196994 2020 5 188608 2020 6 186293 2022 151403 2020 7 197296 2022 2 211055 2020 8 170046 2020 9 191788 2022 3 186096 2020 10 190580 2022 4 210205 2020 11 181823 2020 2022 5 12 150684 181463 2021 1 159144 2022 6 213723 2021 2 190375 2022 7 190006 2021 3 181728 2021 4 197700 2022 8 150795 2021 5 160304 2022 9 194882 2021 6 156805 2021 151236 2022 10 7 172763 2021 8 145698 2022 11 205532 2021 9 185506 62 2022 12 153297 2021 10 190776 2021 11 198963 Sheet1 2021 12 199572

Step by Step Solution

There are 3 Steps involved in it

1 Expert Approved Answer
Step: 1 Unlock blur-text-image
Question Has Been Solved by an Expert!

Get step-by-step solutions from verified subject matter experts

Step: 2 Unlock
Step: 3 Unlock

Students Have Also Explored These Related Mathematics Questions!