

Question: questlon :5 2 p1 Using the example on the Desmos presentation: Suppose a certain drug can lower a speeding heart rate between 0 seconds (immediately)
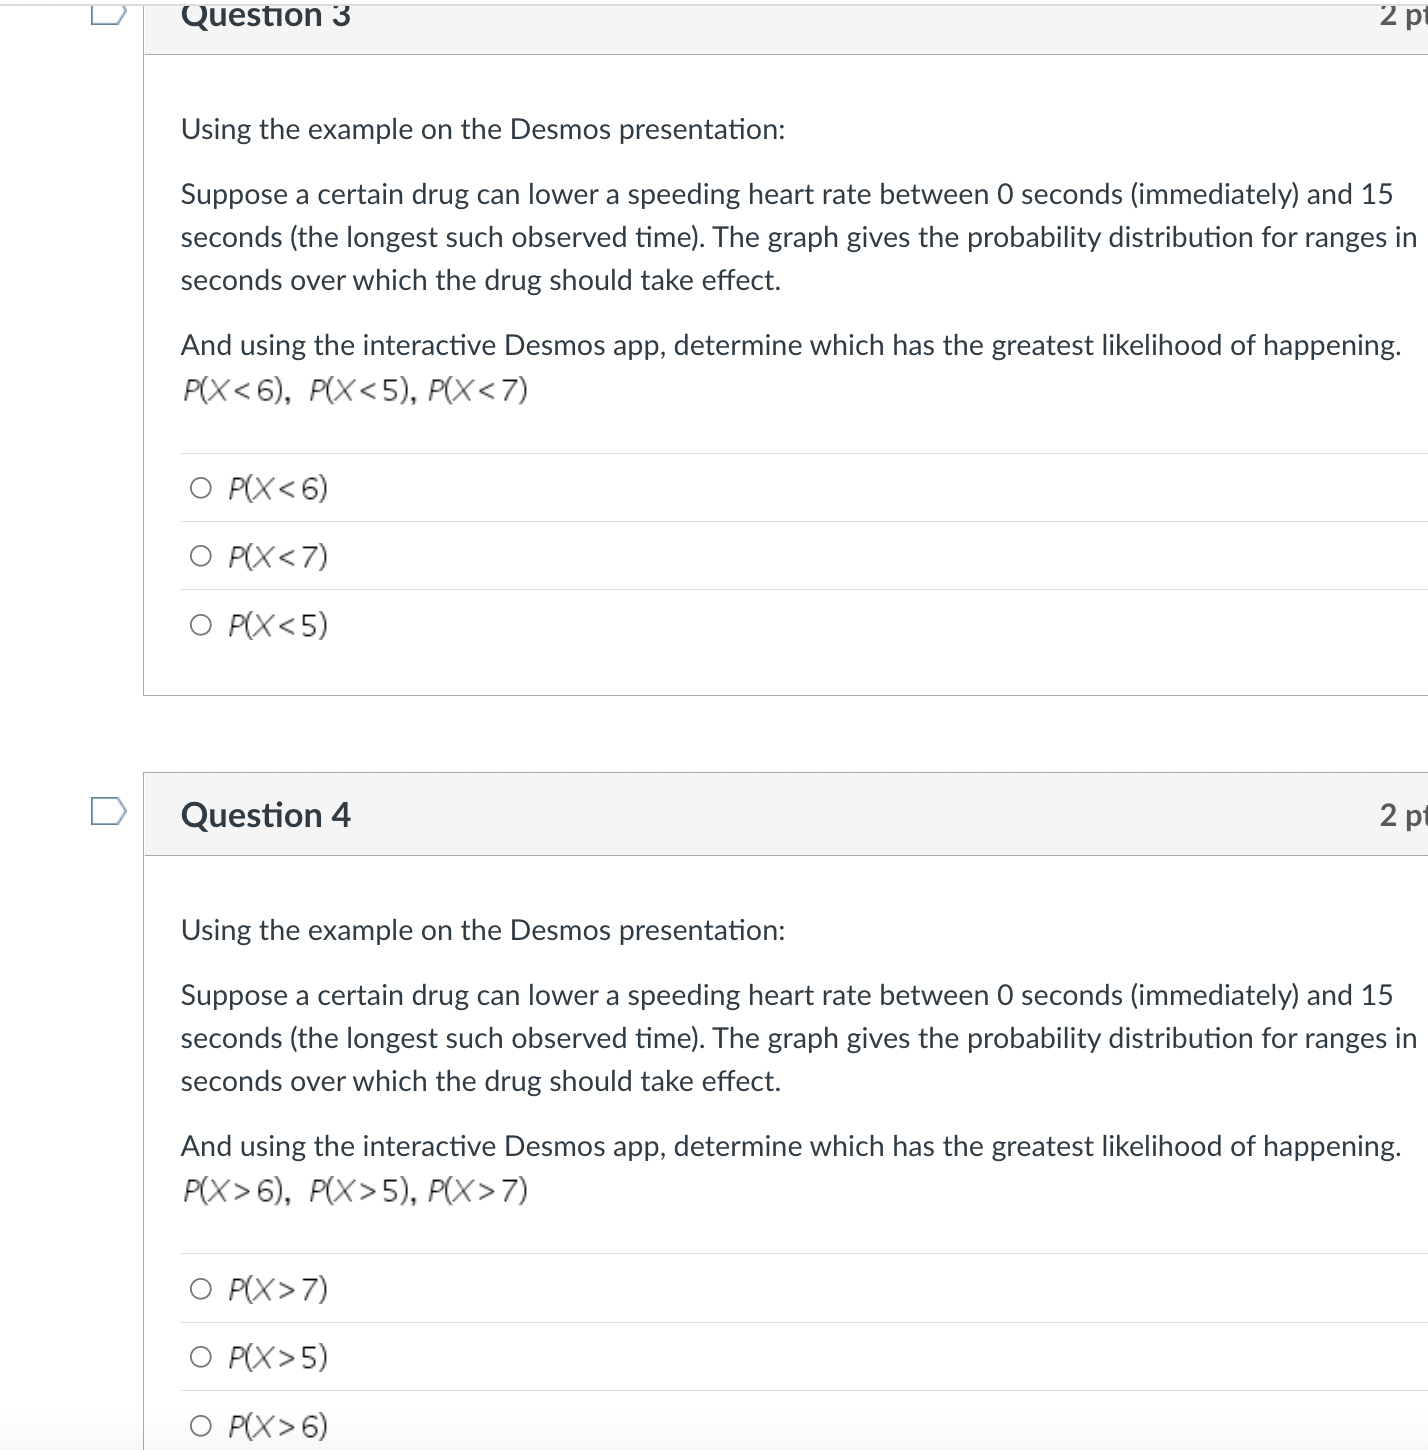
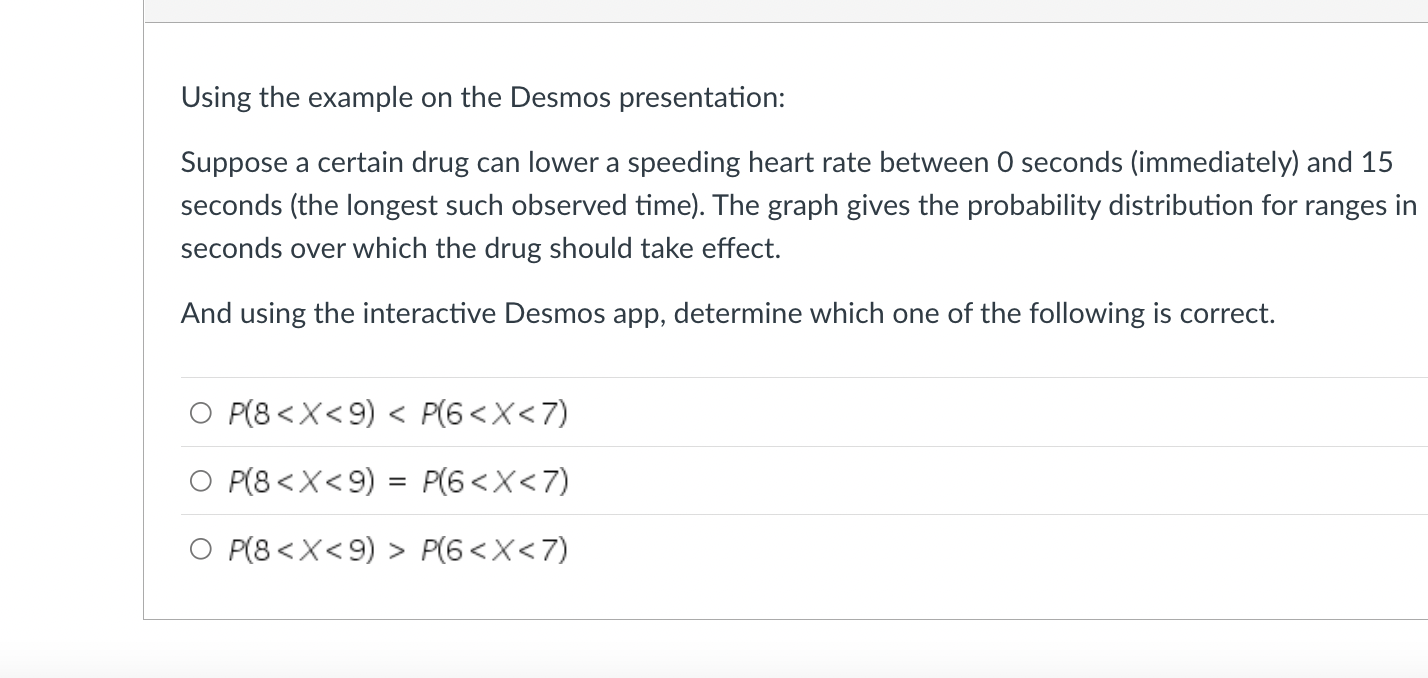
questlon :5 2 p1 Using the example on the Desmos presentation: Suppose a certain drug can lower a speeding heart rate between 0 seconds (immediately) and 15 seconds (the longest such observed time). The graph gives the probability distribution for ranges in seconds over which the drug should take effect. And using the interactive Desmos app, determine which has the greatest likelihood of happening. P(X 6), P(X> 5), P(X> 7) O P(X> 7) O P(X> S) O P(X> 6) Using the example on the Desmos presentation: Suppose a certain drug can lower a speeding heart rate between 0 seconds (immediately) and 15 seconds (the longest such observed time). The graph gives the probability distribution for ranges in seconds over which the drug should take effect. And using the interactive Desmos app, determine which one of the following is correct. 0 P(8
Step by Step Solution
There are 3 Steps involved in it

Get step-by-step solutions from verified subject matter experts