Question: Queueing at a TSA Checkpoint: Managing Variability in Business Process Flows Recall that at Newark Liberty International Airport Terminal A, there are 3 separate TSA
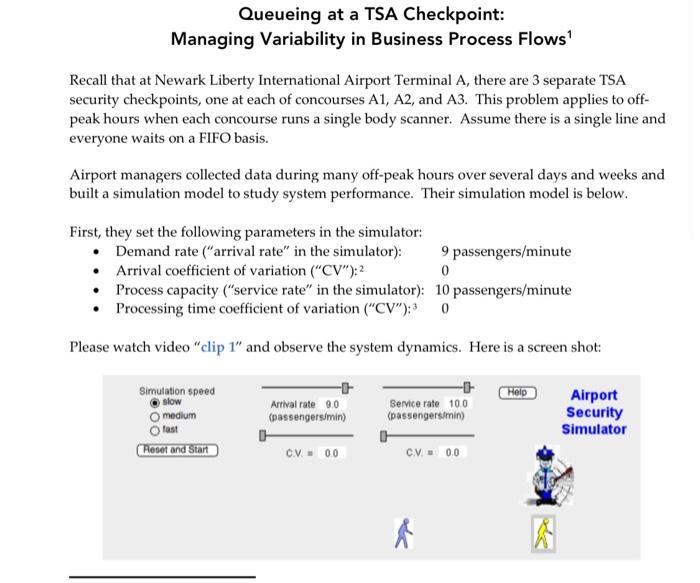
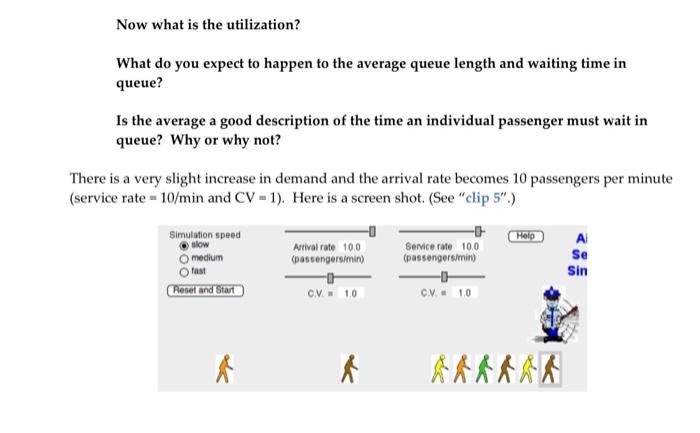
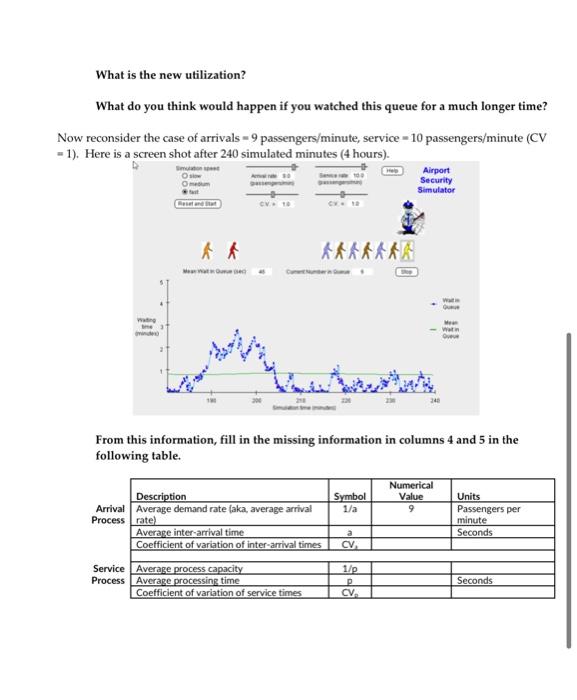
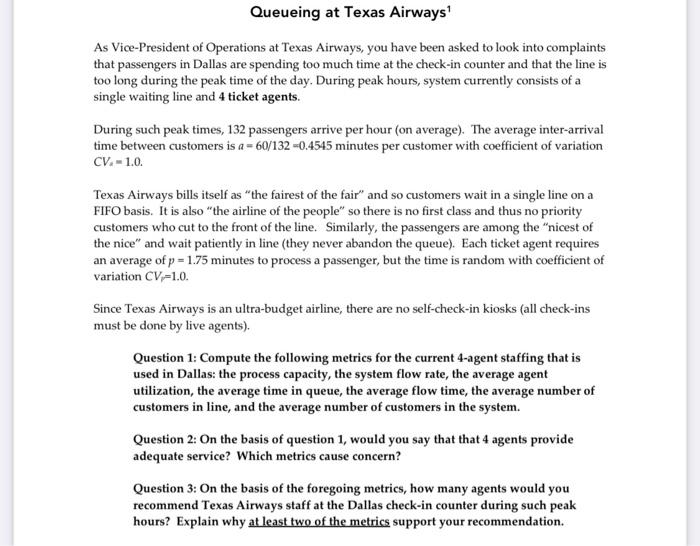
Queueing at a TSA Checkpoint: Managing Variability in Business Process Flows Recall that at Newark Liberty International Airport Terminal A, there are 3 separate TSA security checkpoints, one at each of concourses A1, A2, and A3. This problem applies to off- peak hours when each concourse runs a single body scanner. Assume there is a single line and everyone waits on a FIFO basis. Airport managers collected data during many off-peak hours over several days and weeks and built a simulation model to study system performance. Their simulation model is below. First, they set the following parameters in the simulator: Demand rate ("arrival rate" in the simulator): 9 passengers/minute Arrival coefficient of variation ("CV"):2 0 Process capacity ("service rate" in the simulator): 10 passengers/minute Processing time coefficient of variation ("CV"):30 Please watch video clip 1" and observe the system dynamics. Here is a screen shot: Help Simulation speed slow medium fast (Reset and Start - Arrival rate 9.0 (passengers/min) . CV. - 00 -- Service rate 100 (passengersimin) . CV 0.0 Airport Security Simulator A Now what is the utilization? What do you expect to happen to the average queue length and waiting time in queue? Is the average a good description of the time an individual passenger must wait in queue? Why or why not? There is a very slight increase in demand and the arrival rate becomes 10 passengers per minute (service rate = 10/min and CV = 1). Here is a screen shot. (See "clip 5".) Help Simulation speed slow medium fast Reset and Start Service rate 100 (passengers/min) Se Arrival rate 100 (passengersimin) -D CV = 10 Sin C... 10 od A AARRRR What is the new utilization? What do you think would happen if you watched this queue for a much longer time? Now reconsider the case of arrivals - 9 passengers/minute, service 10 passengers/minute (CV = 1). Here is a screen shot after 240 simulated minutes (4 hours). Airport Security Simulator CV 10 A A AAAAAAA w wat Wat From this information, fill in the missing information in columns 4 and 5 in the following table. Symbol 1/a Numerical Value 9 Units Passengers per minute Seconds a Description Arrival Average demand rate (aka, average arrival Process rate) Average inter arrival time Coefficient of variation of inter-arrival times Service Average process capacity Process Average processing time Coefficient of variation of service times CV. 1/p Seconds CVA Queueing at Texas Airways As Vice-President of Operations at Texas Airways, you have been asked to look into complaints that passengers in Dallas are spending too much time at the check-in counter and that the line is too long during the peak time of the day. During peak hours, system currently consists of a single waiting line and 4 ticket agents. During such peak times, 132 passengers arrive per hour (on average). The average inter-arrival time between customers is a = 60/132 -0.4545 minutes per customer with coefficient of variation CV.-1.0. Texas Airways bills itself as "the fairest of the fair" and so customers wait in a single line on a FIFO basis. It is also "the airline of the people" so there is no first class and thus no priority customers who cut to the front of the line. Similarly, the passengers are among the "nicest of the nice" and wait patiently in line (they never abandon the queue). Each ticket agent requires an average of p = 1.75 minutes to process a passenger, but the time is random with coefficient of variation CV.-1.0. Since Texas Airways is an ultra-budget airline, there are no self-check-in kiosks (all check-ins must be done by live agents). Question 1: Compute the following metrics for the current 4-agent staffing that is used in Dallas: the process capacity, the system flow rate, the average agent utilization, the average time in queue, the average flow time, the average number of customers in line, and the average number of customers in the system. Question 2: On the basis of question 1, would you say that that 4 agents provide adequate service? Which metrics cause concern? Question 3: On the basis of the foregoing metrics, how many agents would you recommend Texas Airways staff at the Dallas check-in counter during such peak hours? Explain why at least two of the metrics support your recommendation. Queueing at a TSA Checkpoint: Managing Variability in Business Process Flows Recall that at Newark Liberty International Airport Terminal A, there are 3 separate TSA security checkpoints, one at each of concourses A1, A2, and A3. This problem applies to off- peak hours when each concourse runs a single body scanner. Assume there is a single line and everyone waits on a FIFO basis. Airport managers collected data during many off-peak hours over several days and weeks and built a simulation model to study system performance. Their simulation model is below. First, they set the following parameters in the simulator: Demand rate ("arrival rate" in the simulator): 9 passengers/minute Arrival coefficient of variation ("CV"):2 0 Process capacity ("service rate" in the simulator): 10 passengers/minute Processing time coefficient of variation ("CV"):30 Please watch video clip 1" and observe the system dynamics. Here is a screen shot: Help Simulation speed slow medium fast (Reset and Start - Arrival rate 9.0 (passengers/min) . CV. - 00 -- Service rate 100 (passengersimin) . CV 0.0 Airport Security Simulator A Now what is the utilization? What do you expect to happen to the average queue length and waiting time in queue? Is the average a good description of the time an individual passenger must wait in queue? Why or why not? There is a very slight increase in demand and the arrival rate becomes 10 passengers per minute (service rate = 10/min and CV = 1). Here is a screen shot. (See "clip 5".) Help Simulation speed slow medium fast Reset and Start Service rate 100 (passengers/min) Se Arrival rate 100 (passengersimin) -D CV = 10 Sin C... 10 od A AARRRR What is the new utilization? What do you think would happen if you watched this queue for a much longer time? Now reconsider the case of arrivals - 9 passengers/minute, service 10 passengers/minute (CV = 1). Here is a screen shot after 240 simulated minutes (4 hours). Airport Security Simulator CV 10 A A AAAAAAA w wat Wat From this information, fill in the missing information in columns 4 and 5 in the following table. Symbol 1/a Numerical Value 9 Units Passengers per minute Seconds a Description Arrival Average demand rate (aka, average arrival Process rate) Average inter arrival time Coefficient of variation of inter-arrival times Service Average process capacity Process Average processing time Coefficient of variation of service times CV. 1/p Seconds CVA Queueing at Texas Airways As Vice-President of Operations at Texas Airways, you have been asked to look into complaints that passengers in Dallas are spending too much time at the check-in counter and that the line is too long during the peak time of the day. During peak hours, system currently consists of a single waiting line and 4 ticket agents. During such peak times, 132 passengers arrive per hour (on average). The average inter-arrival time between customers is a = 60/132 -0.4545 minutes per customer with coefficient of variation CV.-1.0. Texas Airways bills itself as "the fairest of the fair" and so customers wait in a single line on a FIFO basis. It is also "the airline of the people" so there is no first class and thus no priority customers who cut to the front of the line. Similarly, the passengers are among the "nicest of the nice" and wait patiently in line (they never abandon the queue). Each ticket agent requires an average of p = 1.75 minutes to process a passenger, but the time is random with coefficient of variation CV.-1.0. Since Texas Airways is an ultra-budget airline, there are no self-check-in kiosks (all check-ins must be done by live agents). Question 1: Compute the following metrics for the current 4-agent staffing that is used in Dallas: the process capacity, the system flow rate, the average agent utilization, the average time in queue, the average flow time, the average number of customers in line, and the average number of customers in the system. Question 2: On the basis of question 1, would you say that that 4 agents provide adequate service? Which metrics cause concern? Question 3: On the basis of the foregoing metrics, how many agents would you recommend Texas Airways staff at the Dallas check-in counter during such peak hours? Explain why at least two of the metrics support your recommendation