

Question: quick answer no explanation Construct a stem-and-leaf plot of the test scores 67, 73, 86, 75, 89, 89, 88, 90, 99, 100. How does the
quick answer no explanation

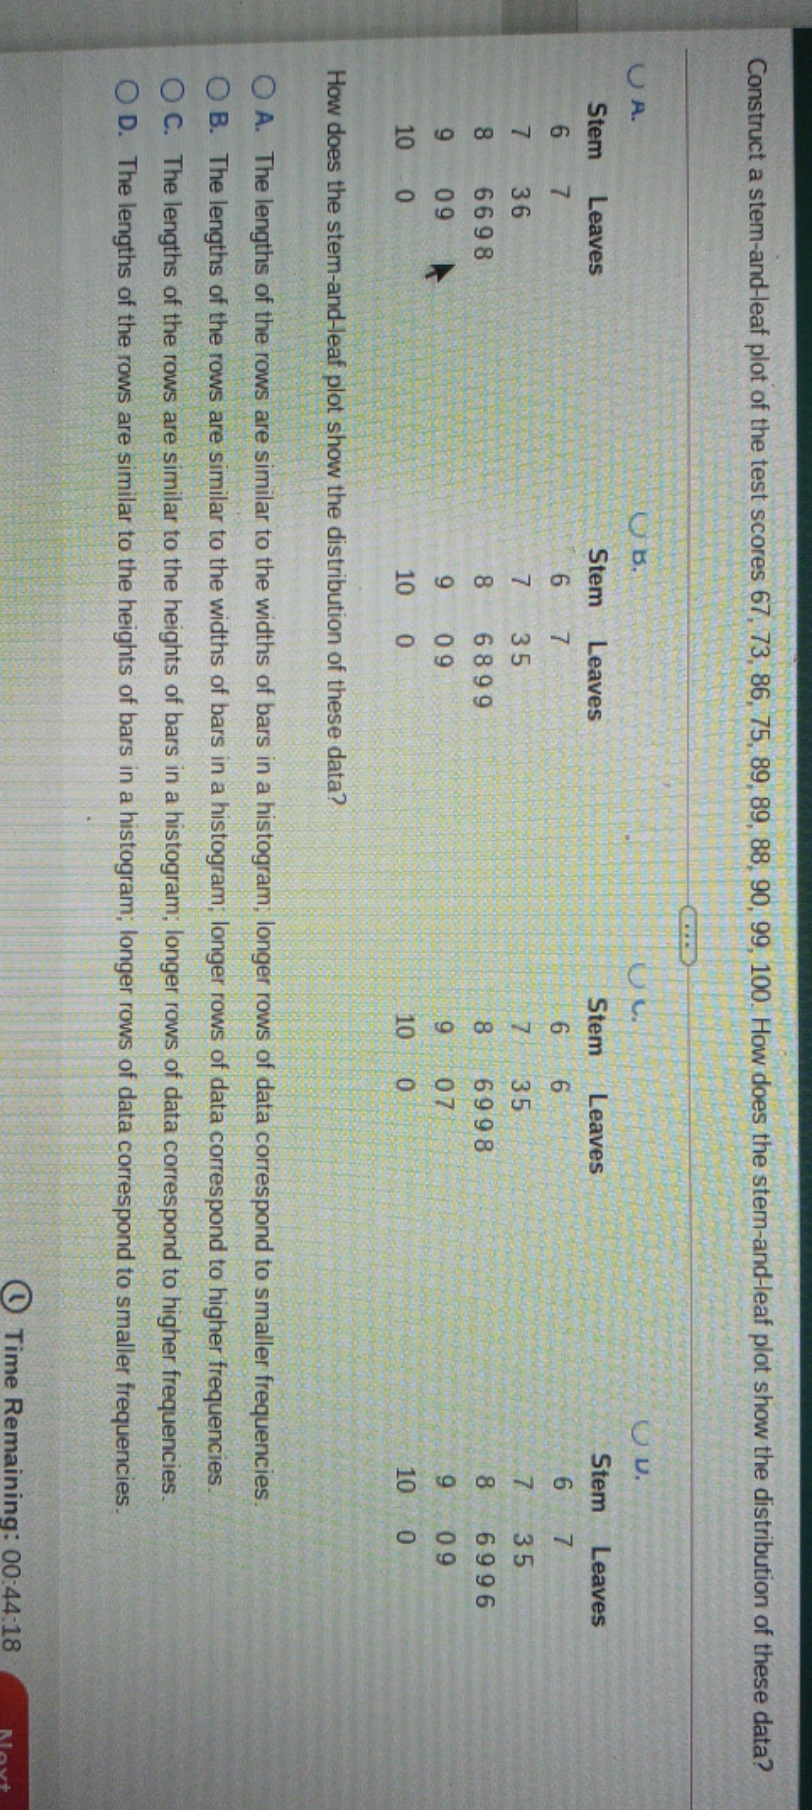
Construct a stem-and-leaf plot of the test scores 67, 73, 86, 75, 89, 89, 88, 90, 99, 100. How does the stem-and-leaf plot show the distribution of these data? UA. OB. OU. Stem Leaves Stem Leaves Stem Leaves Stem Leaves 36 35 6996 60 1 00 0) 9 6698 6899 6998 09 09 07 O O How does the stem-and-leaf plot show the distribution of these data? O A. The lengths of the rows are similar to the widths of bars in a histogram, longer rows of data correspond to smaller frequencies O B. The lengths of the rows are similar to the widths of bars in a histogram; longer rows of data correspond to higher frequencies. O C. The lengths of the rows are similar to the heights of bars in a histogram; longer rows of data correspond to higher frequencies O D. The lengths of the rows are similar to the heights of bars in a histogram; longer rows of data correspond to smaller frequencies. Time Remaining: 00:44:18
Step by Step Solution
There are 3 Steps involved in it

Get step-by-step solutions from verified subject matter experts