

Question: quickly please Midterm Exam Q3: The below table shows the number of defects or their pereentage resulting from different causes us reported by the OM
quickly please 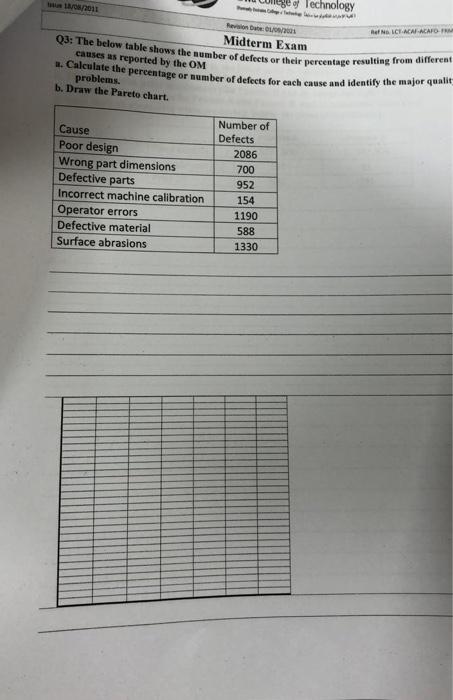
Midterm Exam Q3: The below table shows the number of defects or their pereentage resulting from different causes us reported by the OM 2. Calculate the percentage or number of defects for each cause and identify the major qualit problems. b. Draw the Parete chart
Step by Step Solution
There are 3 Steps involved in it
1 Expert Approved Answer
Step: 1 Unlock

Question Has Been Solved by an Expert!
Get step-by-step solutions from verified subject matter experts
Step: 2 Unlock
Step: 3 Unlock