

Question: Quiz: Module 4: Normal Probability Distribution - Quiz Time Limit: 01:40:00 Submit Quiz This Question: 1 pt 10 of 17 (15 complete) This Quiz: 17
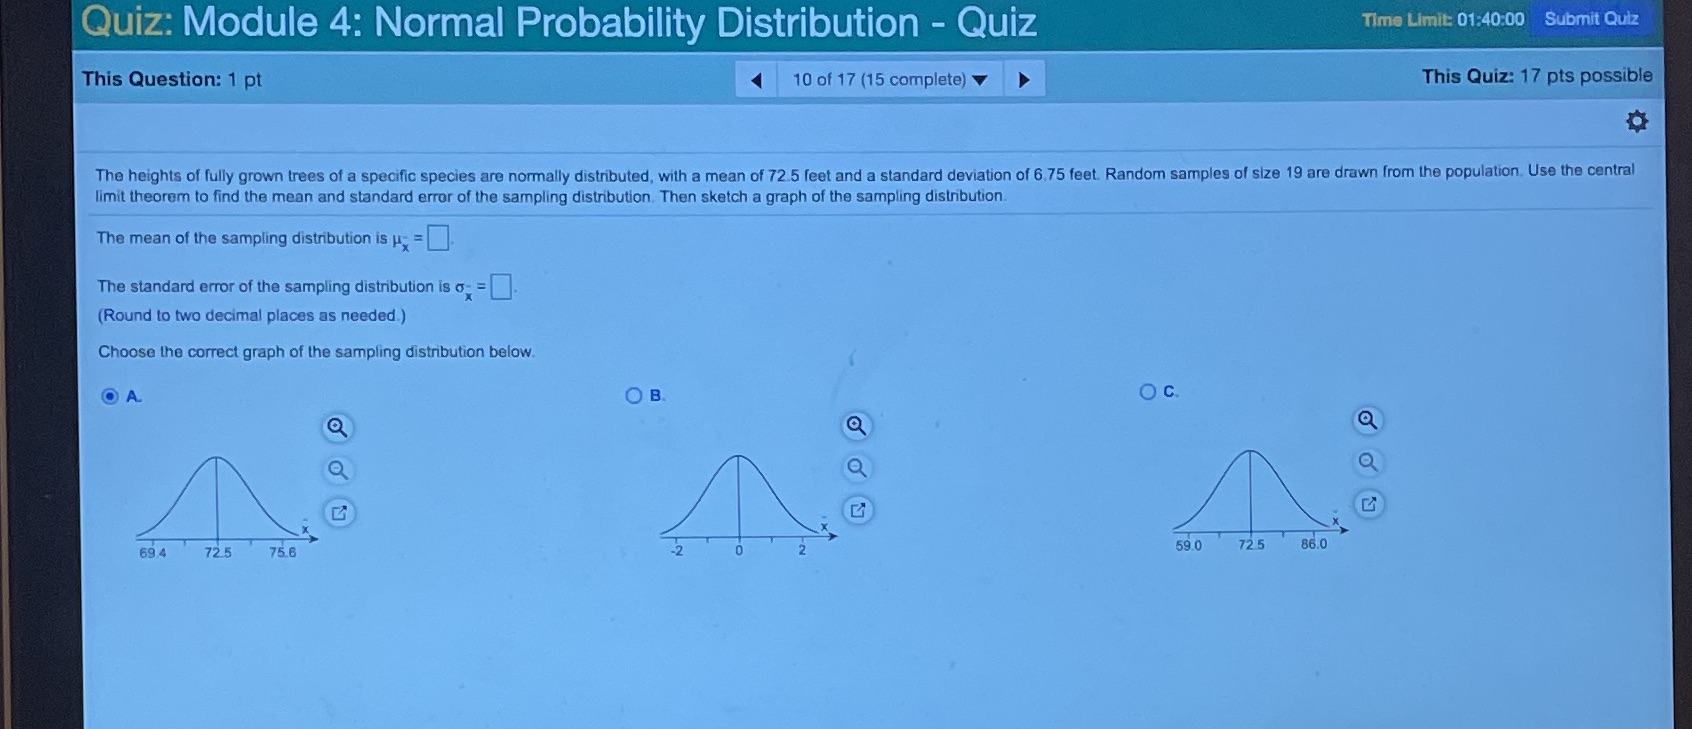
Quiz: Module 4: Normal Probability Distribution - Quiz Time Limit: 01:40:00 Submit Quiz This Question: 1 pt 10 of 17 (15 complete) This Quiz: 17 pts possible The heights of fully grown trees of a specific species are normally distributed, with a mean of 72.5 feet and a standard deviation of 6.75 feet. Random samples of size 19 are drawn from the population, Use the central limit theorem to find the mean and standard error of the sampling distribution. Then sketch a graph of the sampling distribution The mean of the sampling distribution is u = The standard error of the sampling distribution is o = (Round to two decimal places as needed.) Choose the correct graph of the sampling distribution below. A OB O c. 69 4 72.5 75.8 2 59.0 72 5 86.0
Step by Step Solution
There are 3 Steps involved in it

Get step-by-step solutions from verified subject matter experts