

Question: @ Quizzes - MATH302 B005 Fall 20 x * wk2hmwk.docx * *MATH302 Week 2 Test 2 95%.do( x nathanieltaylor630@yahoo.com x * Course Hero * +
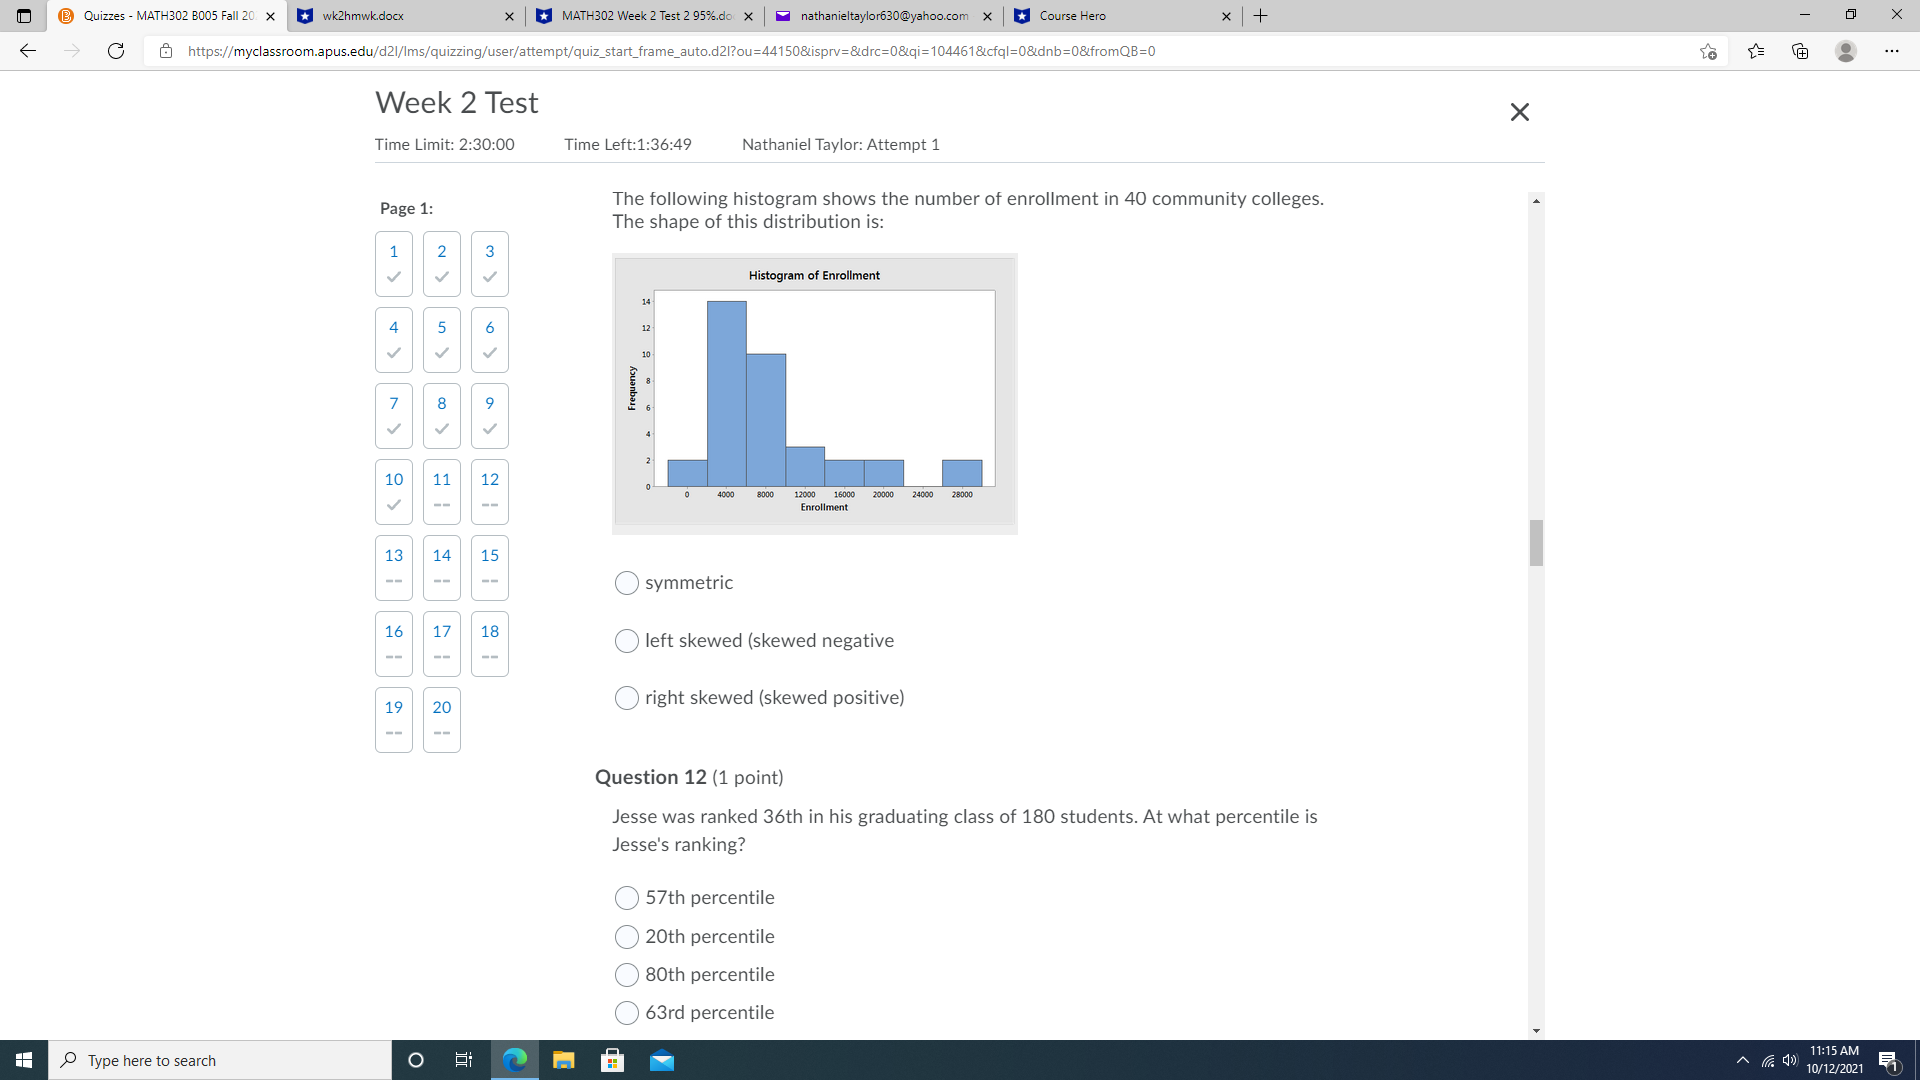
@ Quizzes - MATH302 B005 Fall 20 x * wk2hmwk.docx * *MATH302 Week 2 Test 2 95%.do( x nathanieltaylor630@yahoo.com x * Course Hero * + X https://myclassroom.apus.edu/d21/Ims/quizzing/user/attempt/quiz_start_frame_auto.d21?ou=44150&isprv=&drc=08qi=1044618cfql=0&dnb=0&fromQB=0 ... Week 2 Test X Time Limit: 2:30:00 Time Left:1:36:49 Nathaniel Taylor: Attempt 1 Page 1: The following histogram shows the number of enrollment in 40 community colleges. The shape of this distribution is: 2 ( W Histogram of Enrollment U
Step by Step Solution
There are 3 Steps involved in it
1 Expert Approved Answer
Step: 1 Unlock

Question Has Been Solved by an Expert!
Get step-by-step solutions from verified subject matter experts
Step: 2 Unlock
Step: 3 Unlock