

Question: /quizzes/1210544/take False Question 9 Interpret the effect size (n2) for: t(34) = 2.62, p = .04, n2 =.01 Small Medium O Large Question 10 Normality
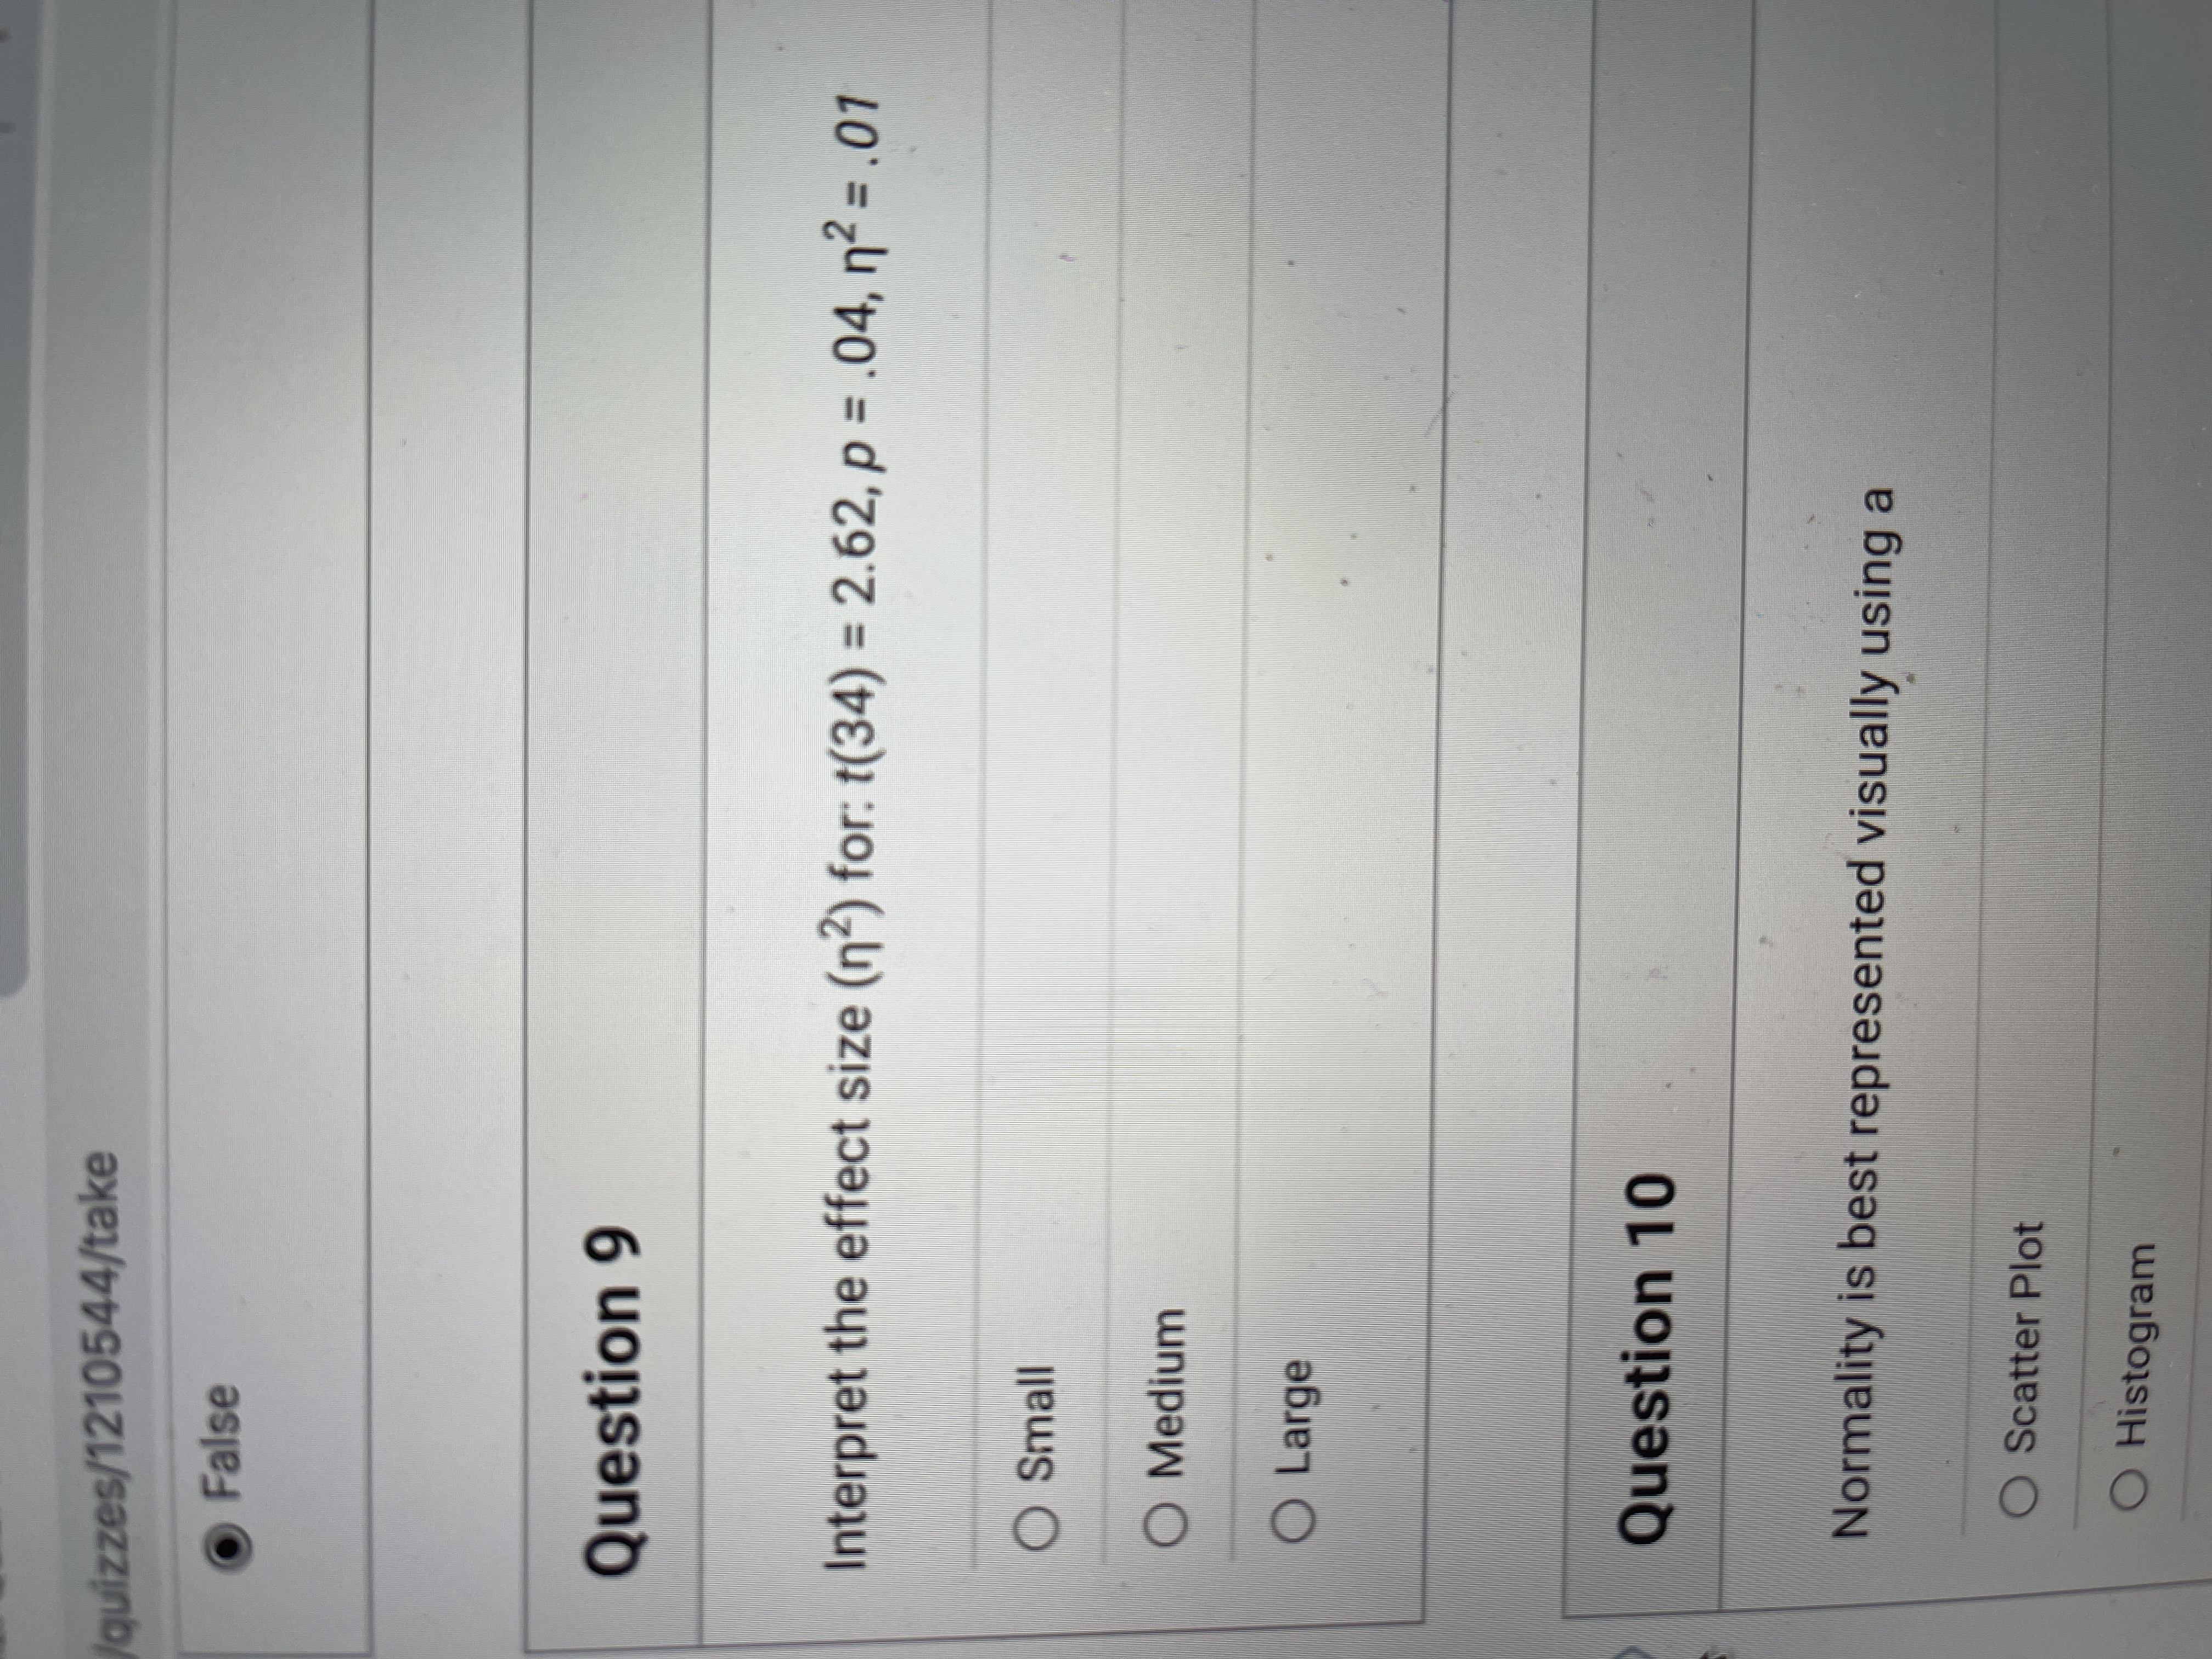
/quizzes/1210544/take False Question 9 Interpret the effect size (n2) for: t(34) = 2.62, p = .04, n2 =.01 Small Medium O Large Question 10 Normality is best represented visually using a Scatter Plot O Histogram
Step by Step Solution
There are 3 Steps involved in it
1 Expert Approved Answer
Step: 1 Unlock

Question Has Been Solved by an Expert!
Get step-by-step solutions from verified subject matter experts
Step: 2 Unlock
Step: 3 Unlock