

Question: q.utoronto.ca + Quiz: Week 2 Pre-Class Essential Video (1.4) Course Modules: MAT135 - Calculus 1 - Fall 2023 w Wiley Course Resources W 1.4 LOGARITHMIC
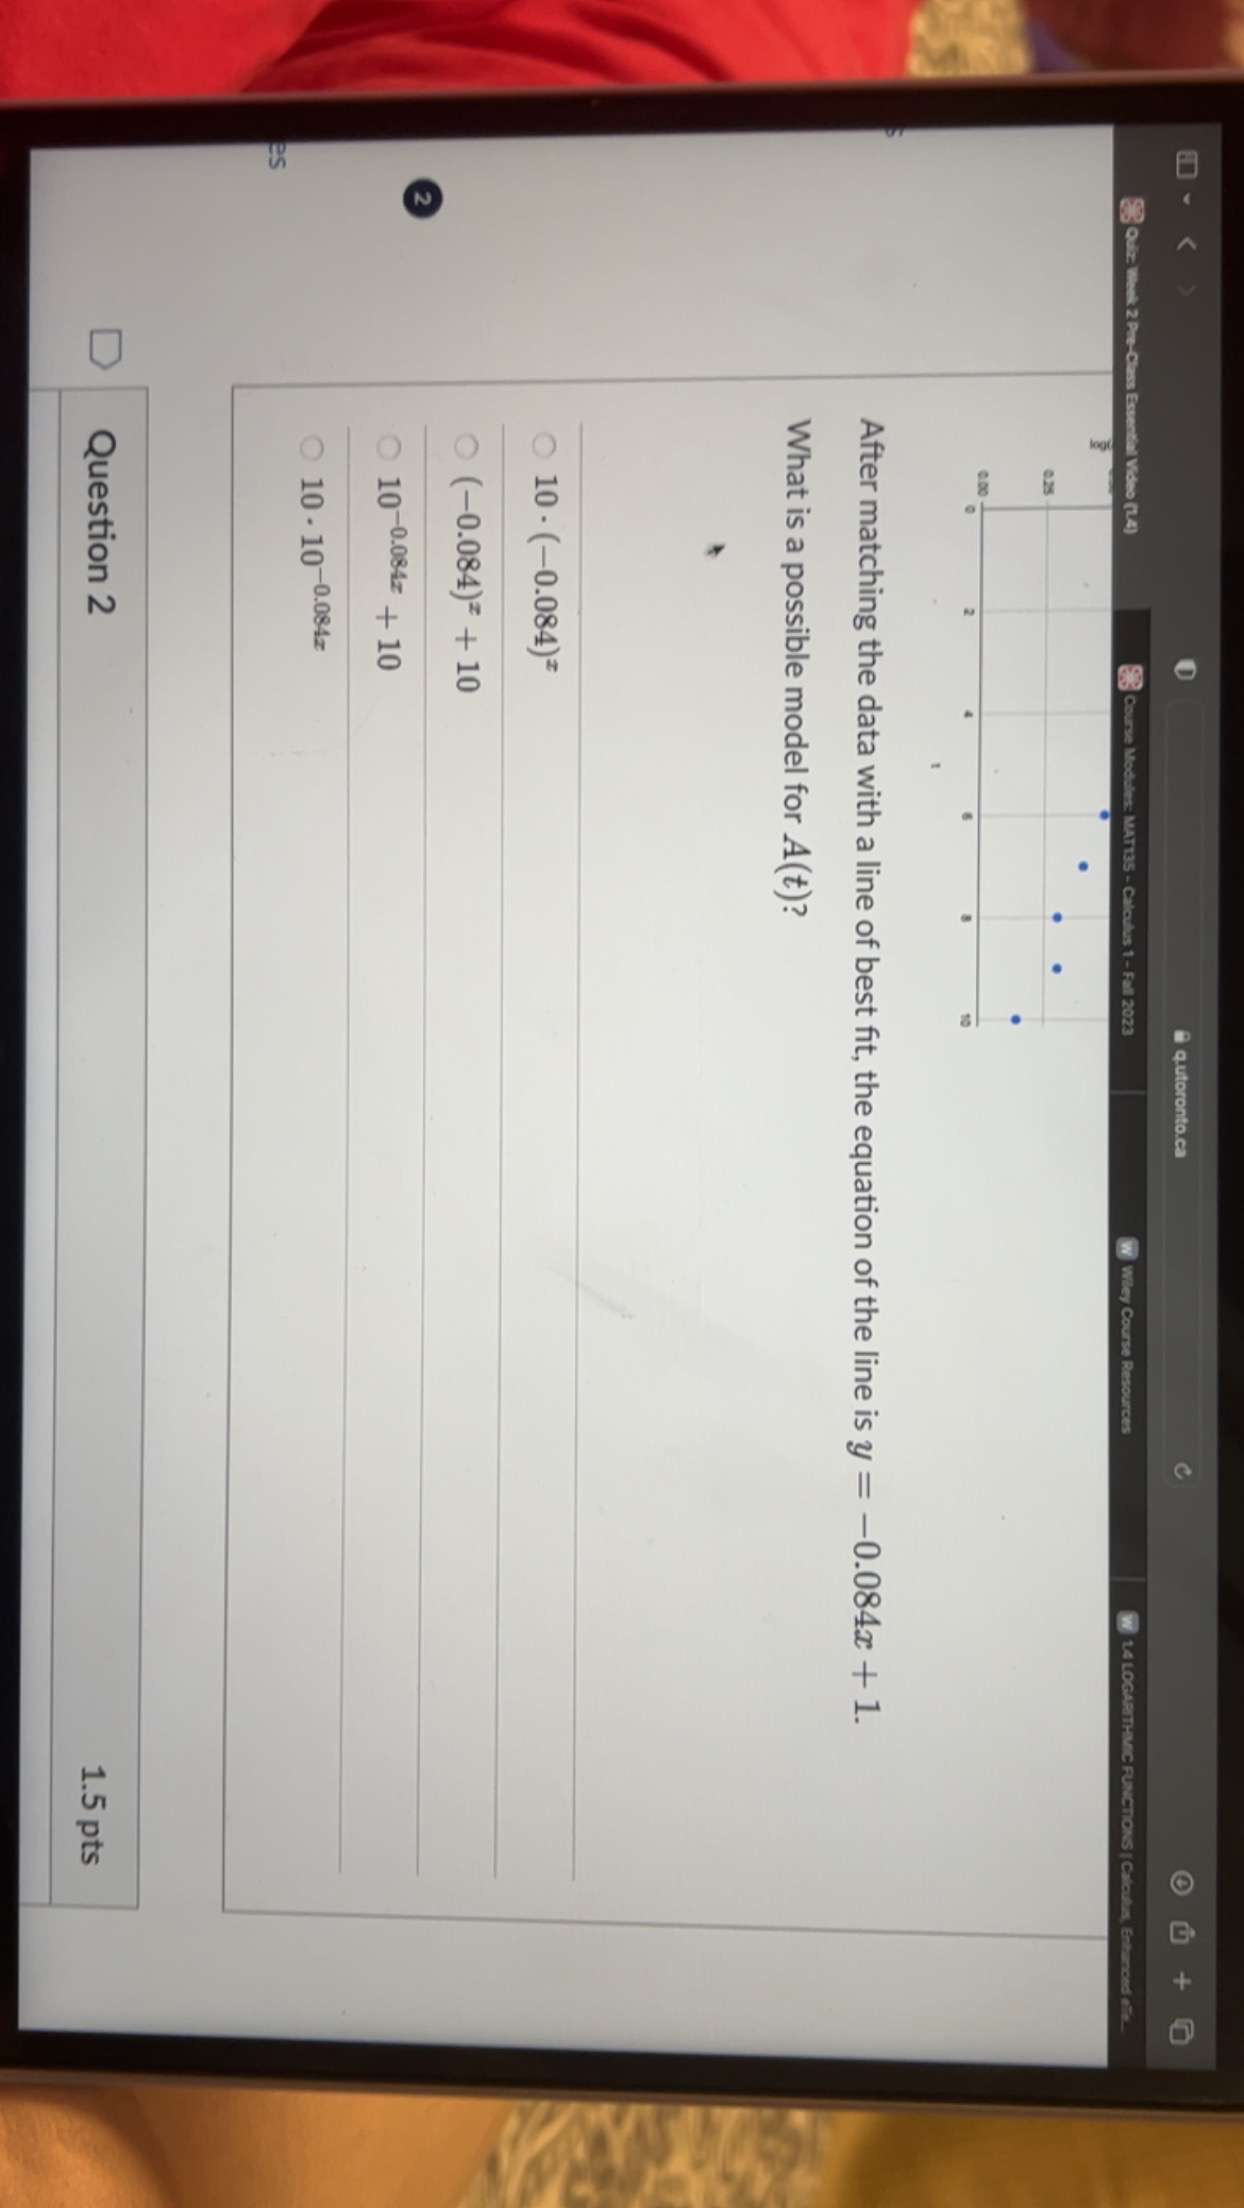
q.utoronto.ca + Quiz: Week 2 Pre-Class Essential Video (1.4) Course Modules: MAT135 - Calculus 1 - Fall 2023 w Wiley Course Resources W 1.4 LOGARITHMIC FUNCTIONS | Calculus, Enhanced eTe. Question 2 1.5 pts Suppose in the example above we wanted to plot In( A) vs t instead of log( A) vs t. How will the graph change? The graph will be exactly the same. The graph will not be linear. The graph of In (A) vs t will be linear, but with a different slope and y-intercept. The graph on the right is a log-log plot, meaning it uses the log of both the size and the metabolic rate of mammals (both axes). Write down one reason why you think this might be useful. Compare the graphs before and after the log transformation.# q.utoronto.ca C + 83 : Week 2 Pre-Class Essential Video (14) Course Modules: MAT135 - Calculus 1 - Fall 2023 w Wiley Course Resources W 1.4 LOGARITHMIC FUNCTIONS | Calculus. After matching the data with a line of best fit, the equation of the line is y = -0.084x + 1. What is a possible model for A(t)? 10 - (-0.084) (-0.084) + 10 10-0.084z + 10 10 - 10-0.084z Question 2 1.5 pts
Step by Step Solution
There are 3 Steps involved in it

Get step-by-step solutions from verified subject matter experts