

Question: Quution 3 (Unit 3) 4 marks In Unit 3 section 5, the annual change in real earnings is explored. In this question we look at
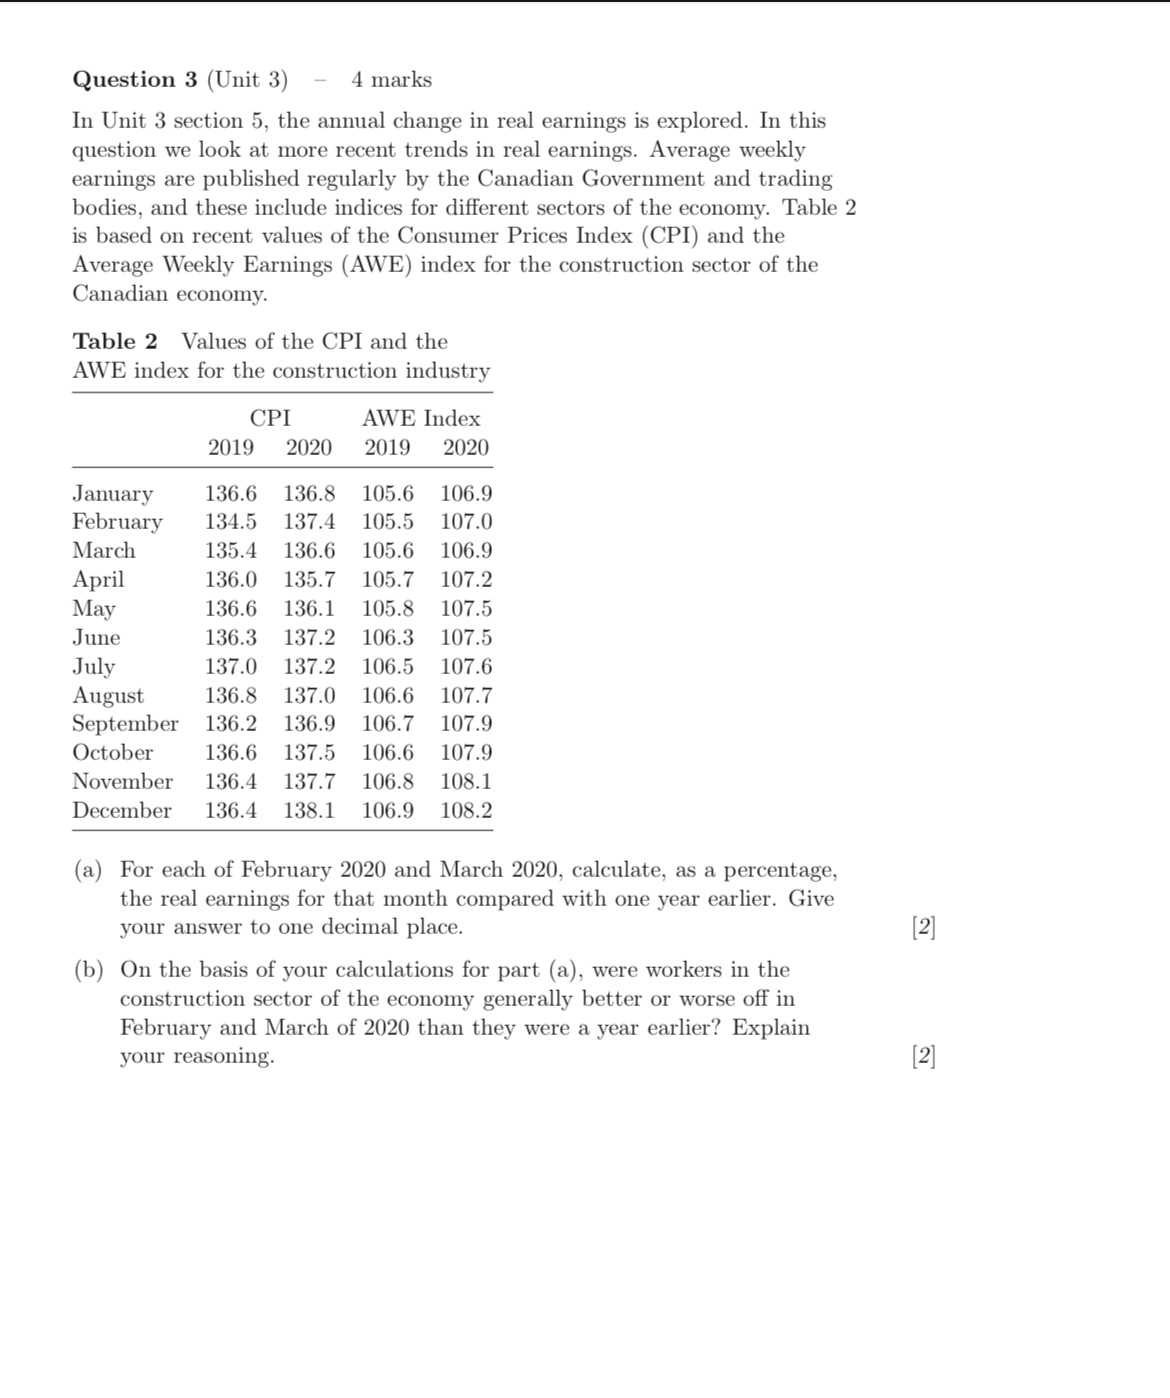
Quution 3 (Unit 3) 4 marks In Unit 3 section 5, the annual change in real earnings is explored. In this question we look at more recent trends in real earnings. Average weekly earnings are published regularly by the Canadian Government and trading bodies, and these include indices for different sectors of the economy. Table 2 is based on recent values of the Consumer Prices Index (CPI) and the Average Weekly Earnings (AWE) index for the construction sector of the Canadian economy. Table 2 Values of the CPI and the AWE index for the construction industry CPI AWE Index 2019 2020 2019 2020 January 136.6 136.8 105.6 106.9 February 134.5 137.4 105.5 107.0 March 135.4 136.6 105.6 106.9 April 136.0 135.7 105.7 107.2 May 136.6 136.1 105.8 107.5 June 136.3 137.2 106.3 107.5 July 137.0 137.2 106.5 107.6 August 136.8 137.0 106.6 107.7 September 136.2 136.9 106.7 107.9 October 136.6 137.5 106.6 107.9 November 136.4 137. 7 106.8 108.1 December 136.4 138.1 106.9 108.2 (a) For each of February 2020 and March 2020, calculate, as a percentage, the real earnings for that month compared with one year earlier. Give your answer to one decimal place. (b) On the basis of your calculations for part (a), were workers in the construction sector of the economy generally better or worse off in February and March of 2020 than they were a year earlier? Explain your reasoning
Step by Step Solution
There are 3 Steps involved in it

Get step-by-step solutions from verified subject matter experts