

Question: r Answer the questions 29, 30 and 31 based on the following information in Exhibit 5. Exhibit 5. By using the following data and forecasting
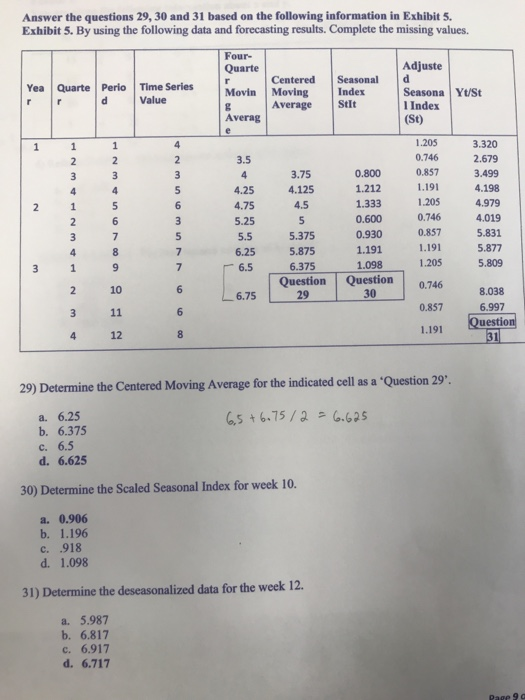
r Answer the questions 29, 30 and 31 based on the following information in Exhibit 5. Exhibit 5. By using the following data and forecasting results. Complete the missing values. Four- Quarte Adjuste r Yea Quarte Perio Time Series Centered d Seasonal Movin Moving Index d Seasona Yt/St Value g Average Stit I Index Averag (St) e 1 1 1 4 1.205 3.320 2 2 2 3.5 0.746 2.679 3 3 3 4 3.75 0.800 0.857 3.499 4 4 5 4.25 4.125 1.212 1.191 4.198 2 1 5 6 4.75 4.5 1.333 1.205 4.979 2 6 3 5.25 5 0.600 0.746 4.019 3 7 5 5.5 5.375 0.930 0.857 5.831 4 8 7 6.25 5.875 1.191 1.191 5.877 3 1 9 7 6.5 6.375 1.098 1.205 5.809 Question Question 2 6 0.746 6.75 29 30 8.038 3 11 6 0.857 6.997 Question 4 1.191 31 10 12 8 29) Determine the Centered Moving Average for the indicated cell as a 'Question 29'. 6,5 +6.75/2 = 6.625 a. 6.25 b. 6.375 c. 6.5 d. 6.625 30) Determine the Scaled Seasonal Index for week 10. a. 0.906 b. 1.196 c. 918 d. 1.098 31) Determine the deseasonalized data for the week 12. a. 5.987 b. 6.817 c. 6.917 d. 6.717 Page 9
Step by Step Solution
There are 3 Steps involved in it

Get step-by-step solutions from verified subject matter experts