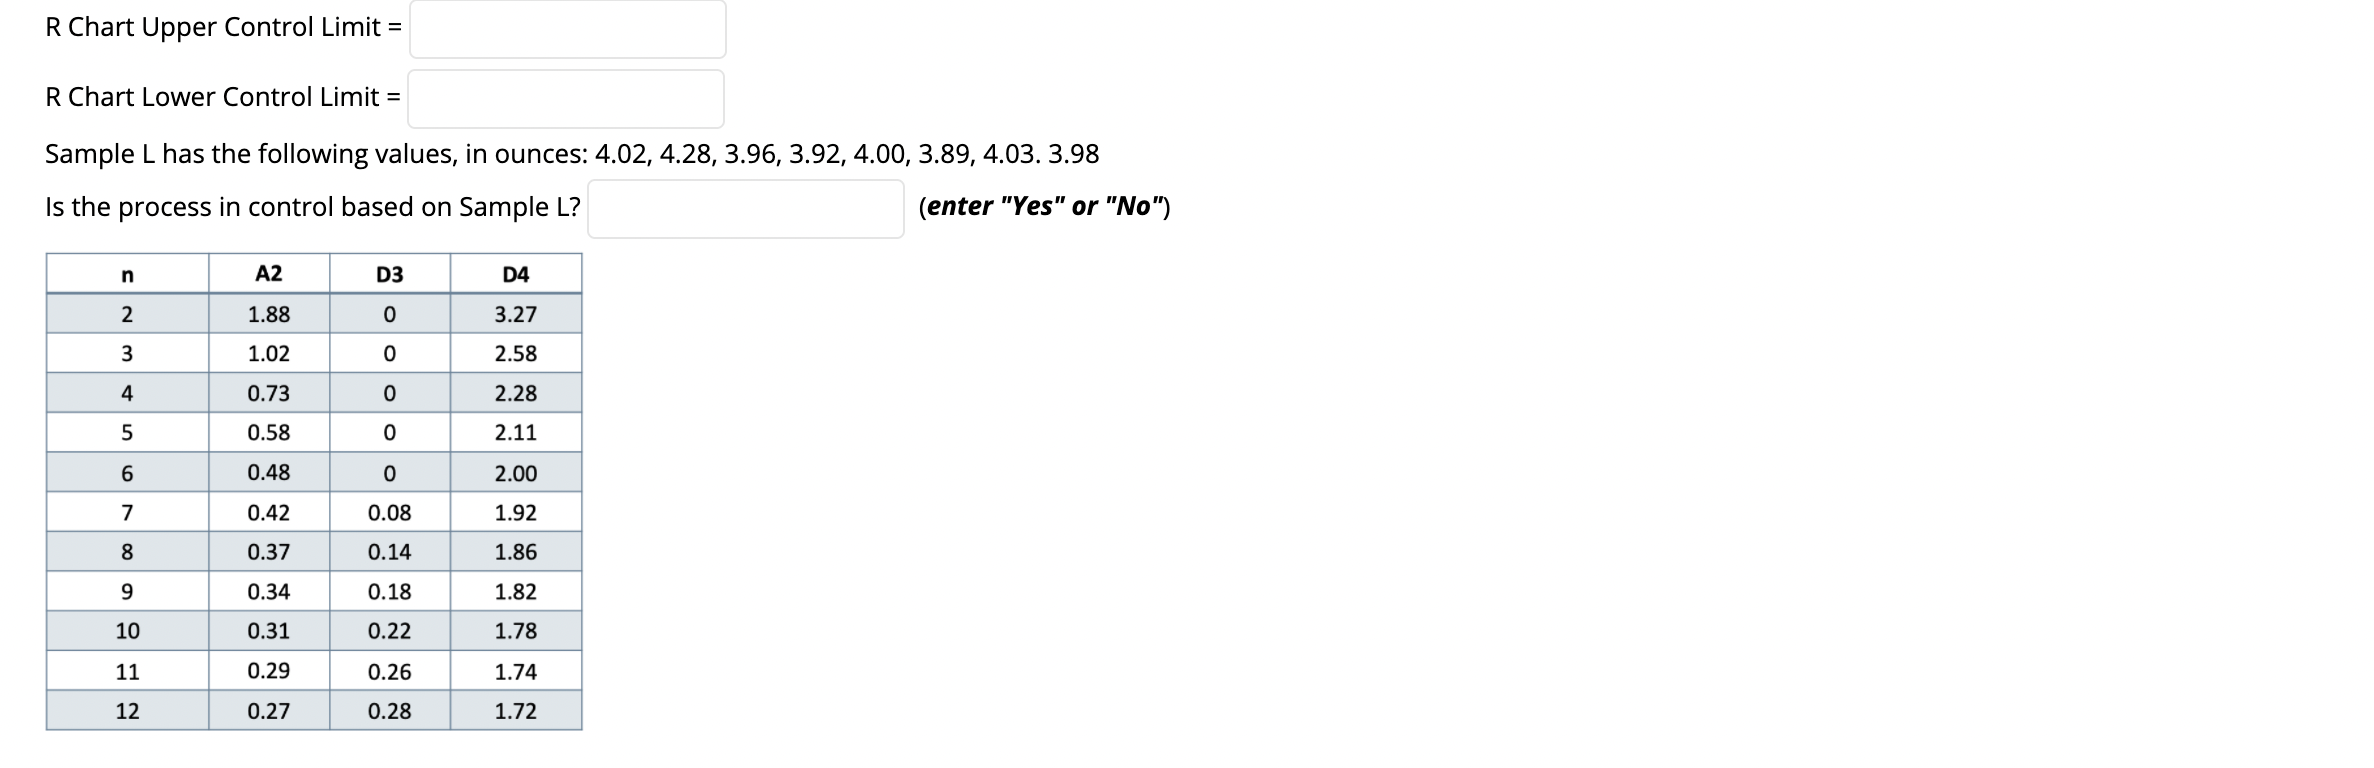
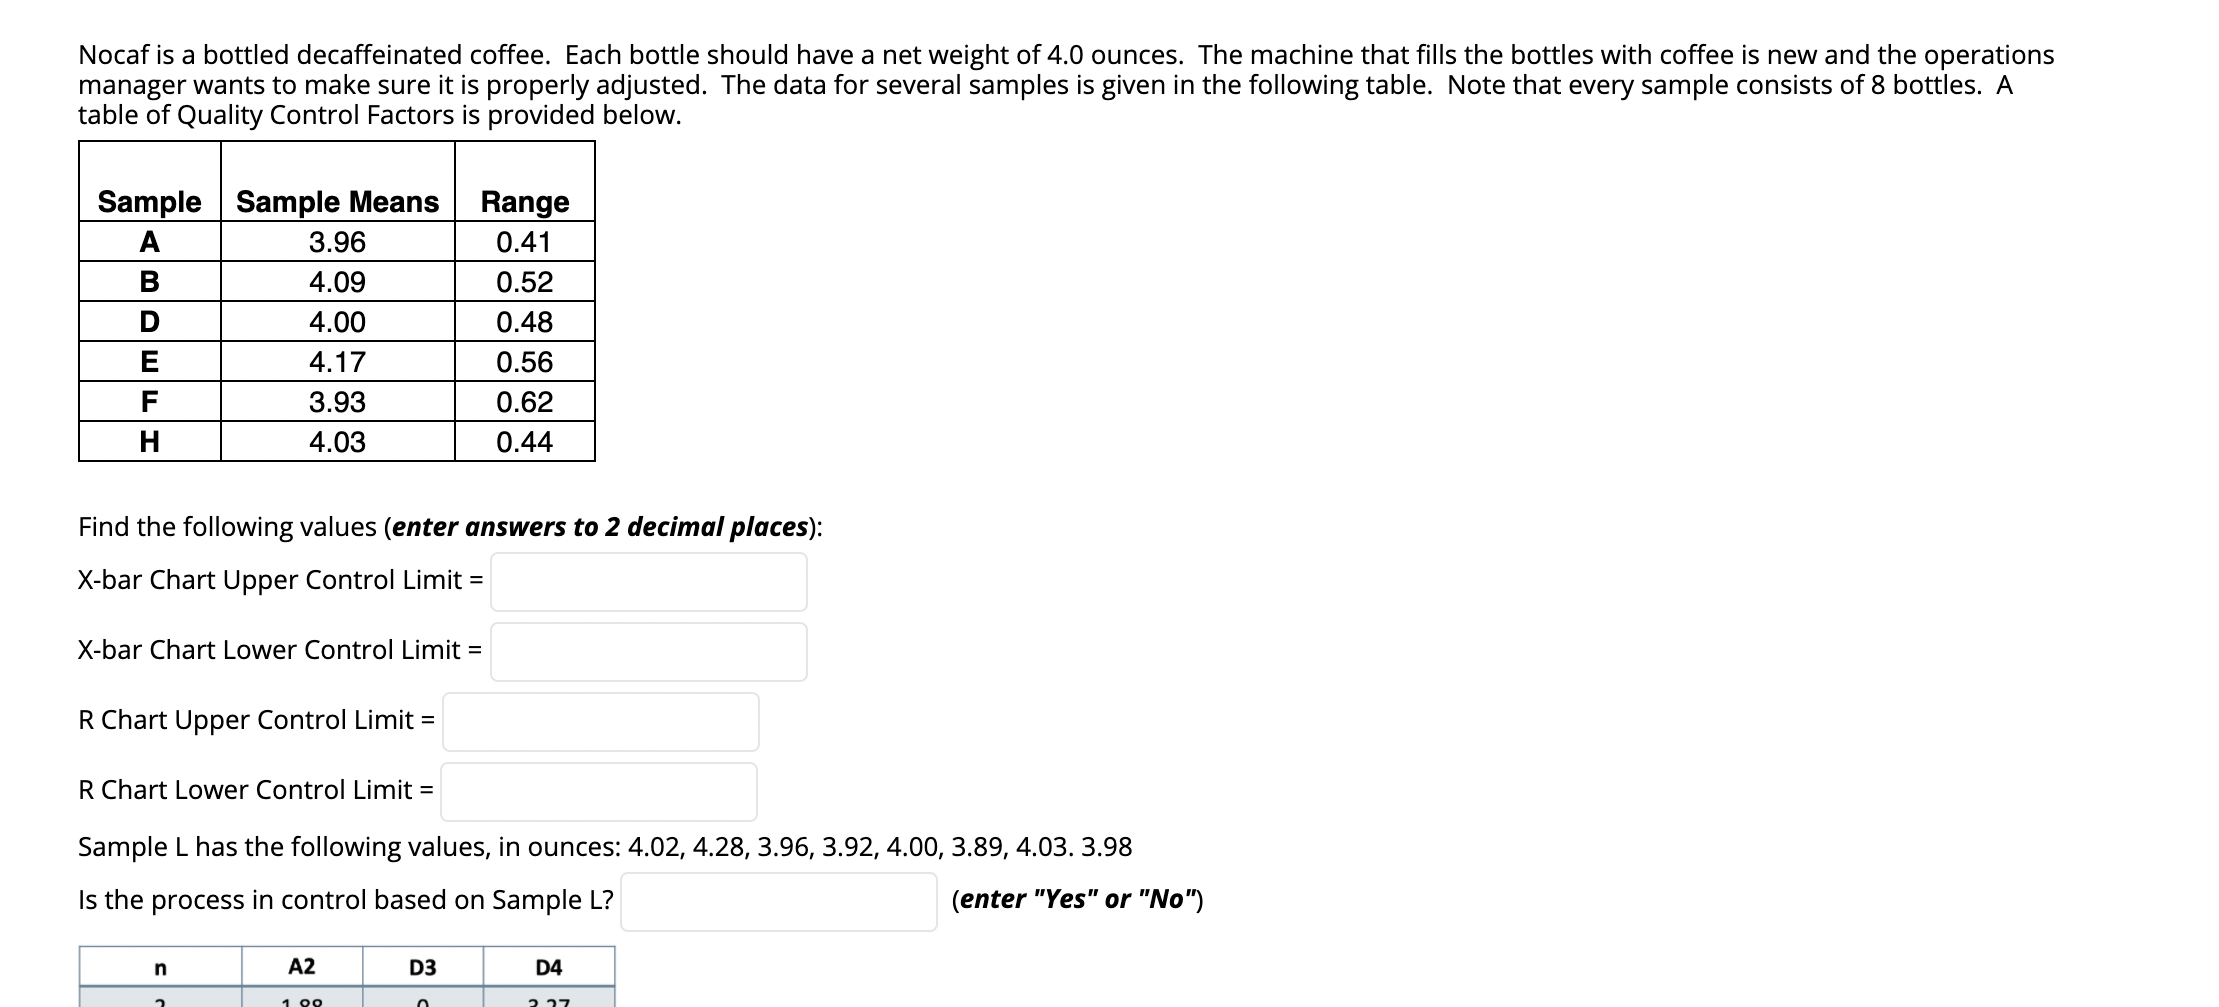
Question: R Chart Upper Control Limit = R Chart Lower Control Limit = Sample L has the following values, in ounces: 4.02, 4.28, 3.96, 3.92, 4.00,

R Chart Upper Control Limit = R Chart LowerR Chart Upper Control Limit = R Chart Lower

R Chart Upper Control Limit = R Chart Lower Control Limit = Sample L has the following values, in ounces: 4.02, 4.28, 3.96, 3.92, 4.00, 3.89, 4.03. 3.98 Is the process in control based on Sample L? (enter "Yes" or "No"). n A2 D3 D4 2 1.88 0 3.27 3 1.02 0 2.58 4 0.73 o 2.28 5 0.58 0 2.11 6 0.48 0 2.00 7 0.42 0.08 1.92 8 0.37 0.14 1.86 9 0.34 0.18 1.82 10 0.31 0.22 1.78 11 0.29 0.26 1.74 12 0.27 0.28 1.72 Nocaf is a bottled decaffeinated coffee. Each bottle should have a net weight of 4.0 ounces. The machine that fills the bottles with coffee is new and the operations manager wants to make sure it is properly adjusted. The data for several samples is given in the following table. Note that every sample consists of 8 bottles. A table of Quality Control Factors is provided below. Sample Sample Means A 3.96 B 4.09 4.00 E 4.17 F 3.93 H 4.03 Range 0.41 0.52 0.48 0.56 0.62 0.44 Find the following values (enter answers to 2 decimal places): X-bar Chart Upper Control Limit = X-bar Chart Lower Control Limit = R Chart Upper Control Limit = R Chart Lower Control Limit = Sample L has the following values, in ounces: 4.02, 4.28, 3.96, 3.92, 4.00, 3.89, 4.03. 3.98 Is the process in control based on Sample L? (enter "Yes" or "No") n A2 D3 D4 1 og n 2 27

Step by Step Solution

There are 3 Steps involved in it

1 Expert Approved Answer
Step: 1 Unlock blur-text-image
Question Has Been Solved by an Expert!

Get step-by-step solutions from verified subject matter experts

Step: 2 Unlock
Step: 3 Unlock

Students Have Also Explored These Related General Management Questions!