

Question: R CODE data sets given are named Site A-2008.csv SiteA-2009.csv SiteA-2010.csv SiteA-2011.csv SiteA-2012.csv SiteB-2012.csv and this is an example of whats inside each file I
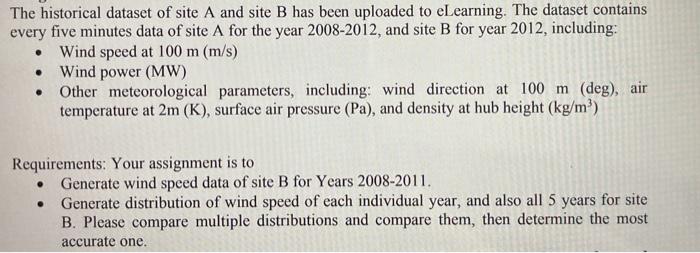
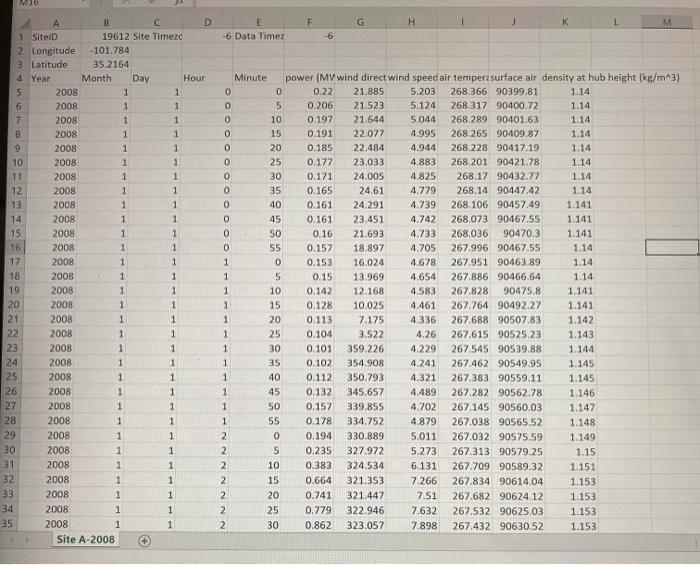
The historical dataset of site A and site B has been uploaded to eLearning. The dataset contains every five minutes data of site A for the year 2008-2012, and site B for year 2012, including: Wind speed at 100 m (m/s) Wind power (MW) Other meteorological parameters, including: wind direction at 100 m (deg), air temperature at 2m(K), surface air pressure (Pa), and density at hub height (kg/mp) Requirements: Your assignment is to Generate wind speed data of site B for Years 2008-2011. Generate distribution of wind speed of each individual year, and also all 5 years for site B. Please compare multiple distributions and compare them, then determine the most accurate one. . M16 F G H M E E -6 Data Timez -6 B C D 1 Sitel 19612 Site Timezc 2 Longitude -101.784 3 Latitude 35.2164 4 Year Month Day Hour 5 2008 1 1 6 2008 1 1 7 2008 1 1 8 2008 1 1 9 2008 1 1 10 2008 1 1 11 2008 1 1 12 2008 1 1 13 2008 1 1 14 2008 1 1 15 2008 1 1 16 2008 1 1 17 2008 1 1 18 2008 1 1 19 2008 1 1 20 2008 1 1 21 2008 1 1 22 2008 1 1 23 2008 1 1 24 2008 1 1 25 2008 1 1 26 2008 1 1 27 2008 1 1 28 2008 1 1 29 2008 1 1 30 2008 1 1 31 2008 1 1 32 2008 1 1 33 2008 1 1 34 2008 1 1 35 2008 1 1 Site A-2008 Minute power (MV wind direct wind speed air tempera surface air density at hub height (kg/ m3) 0 0 0.22 21.885 5.203 268.366 90399.81 1.14 0 5 0.206 21.523 5.124 268 317 90400.72 1.14 10 0.197 21.644 5.044 268,289 90401.63 1.14 0 15 0.191 22.077 4.995 268.265 90409.87 1.14 0 20 0.185 22.484 4.944 268.228 90417.19 1.14 0 25 0.177 23.033 4.883 268.201 90421.78 1.14 0 30 0.171 24.005 4.825 268.17 90432.77 1.14 0 35 0.165 24,61 4.779 268.14 90447.42 1.14 0 40 0.161 24.291 4.739 268.106 90457.49 1.141 0 45 0.161 23.451 4.742 268.073 90467.55 1.141 0 50 0.16 21.693 4.733 268.036 90470.3 1.141 0 55 0.157 18.897 4.705 267 996 90467 55 1.14 1 0 0.153 16.024 4.678 267.951 90463.89 1.14 1 5 0.15 13.969 4.654 267.886 90466.64 1.14 1 10 0.142 12.168 4.583 267.828 90475.8 1.141 1 15 0.128 10.025 4.461 267.764 90492.27 1.141 1 20 0.113 7.175 4.336 267.688 90507.83 1.142 1 25 0.104 3.522 4.26 267.615 90525.23 1.143 1 30 0.101 359.226 4.229 267.545 90539.88 1.144 1 35 0.102 354.908 4.241 267.462 90549.95 1.145 1 40 0.112 350.793 4.321 267.383 90559.11 1.145 1 45 0.132 345.657 4.489 267.282 90562.78 1.146 1 50 0.157 339.855 4.702 267.145 90560,03 1.147 1 55 0.178 334.752 4.879 267.038 90565.52 1.148 2 0 0.194 330.889 5.011 267.032 90575.59 1.149 2 5 0.235 327.972 5.273 267.313 90579.25 1.15 2 10 0.383 324.534 6.131 267.709 90589.32 1.151 2 15 0.664 321.353 7.266 267.834 90614.04 1.153 2 20 0.741 321.447 7.51 267.682 90624.12 1.153 2 25 0.779 322.946 7.632 267.532 90625.03 1.153 2 30 0.862 323.057 7.898 267,432 90630.52 1.153 The historical dataset of site A and site B has been uploaded to eLearning. The dataset contains every five minutes data of site A for the year 2008-2012, and site B for year 2012, including: Wind speed at 100 m (m/s) Wind power (MW) Other meteorological parameters, including: wind direction at 100 m (deg), air temperature at 2m(K), surface air pressure (Pa), and density at hub height (kg/mp) Requirements: Your assignment is to Generate wind speed data of site B for Years 2008-2011. Generate distribution of wind speed of each individual year, and also all 5 years for site B. Please compare multiple distributions and compare them, then determine the most accurate one. . M16 F G H M E E -6 Data Timez -6 B C D 1 Sitel 19612 Site Timezc 2 Longitude -101.784 3 Latitude 35.2164 4 Year Month Day Hour 5 2008 1 1 6 2008 1 1 7 2008 1 1 8 2008 1 1 9 2008 1 1 10 2008 1 1 11 2008 1 1 12 2008 1 1 13 2008 1 1 14 2008 1 1 15 2008 1 1 16 2008 1 1 17 2008 1 1 18 2008 1 1 19 2008 1 1 20 2008 1 1 21 2008 1 1 22 2008 1 1 23 2008 1 1 24 2008 1 1 25 2008 1 1 26 2008 1 1 27 2008 1 1 28 2008 1 1 29 2008 1 1 30 2008 1 1 31 2008 1 1 32 2008 1 1 33 2008 1 1 34 2008 1 1 35 2008 1 1 Site A-2008 Minute power (MV wind direct wind speed air tempera surface air density at hub height (kg/ m3) 0 0 0.22 21.885 5.203 268.366 90399.81 1.14 0 5 0.206 21.523 5.124 268 317 90400.72 1.14 10 0.197 21.644 5.044 268,289 90401.63 1.14 0 15 0.191 22.077 4.995 268.265 90409.87 1.14 0 20 0.185 22.484 4.944 268.228 90417.19 1.14 0 25 0.177 23.033 4.883 268.201 90421.78 1.14 0 30 0.171 24.005 4.825 268.17 90432.77 1.14 0 35 0.165 24,61 4.779 268.14 90447.42 1.14 0 40 0.161 24.291 4.739 268.106 90457.49 1.141 0 45 0.161 23.451 4.742 268.073 90467.55 1.141 0 50 0.16 21.693 4.733 268.036 90470.3 1.141 0 55 0.157 18.897 4.705 267 996 90467 55 1.14 1 0 0.153 16.024 4.678 267.951 90463.89 1.14 1 5 0.15 13.969 4.654 267.886 90466.64 1.14 1 10 0.142 12.168 4.583 267.828 90475.8 1.141 1 15 0.128 10.025 4.461 267.764 90492.27 1.141 1 20 0.113 7.175 4.336 267.688 90507.83 1.142 1 25 0.104 3.522 4.26 267.615 90525.23 1.143 1 30 0.101 359.226 4.229 267.545 90539.88 1.144 1 35 0.102 354.908 4.241 267.462 90549.95 1.145 1 40 0.112 350.793 4.321 267.383 90559.11 1.145 1 45 0.132 345.657 4.489 267.282 90562.78 1.146 1 50 0.157 339.855 4.702 267.145 90560,03 1.147 1 55 0.178 334.752 4.879 267.038 90565.52 1.148 2 0 0.194 330.889 5.011 267.032 90575.59 1.149 2 5 0.235 327.972 5.273 267.313 90579.25 1.15 2 10 0.383 324.534 6.131 267.709 90589.32 1.151 2 15 0.664 321.353 7.266 267.834 90614.04 1.153 2 20 0.741 321.447 7.51 267.682 90624.12 1.153 2 25 0.779 322.946 7.632 267.532 90625.03 1.153 2 30 0.862 323.057 7.898 267,432 90630.52 1.153
Step by Step Solution
There are 3 Steps involved in it

Get step-by-step solutions from verified subject matter experts