

Question: R Code, please provide the necessary code based off of the provided lab/assignment. Question: Textbook/Assignment: 4.7.3 Linear Discriminant Analysis Submit: the screenshot of the confusion
R Code, please provide the necessary code based off of the provided lab/assignment.
Question:

Textbook/Assignment:
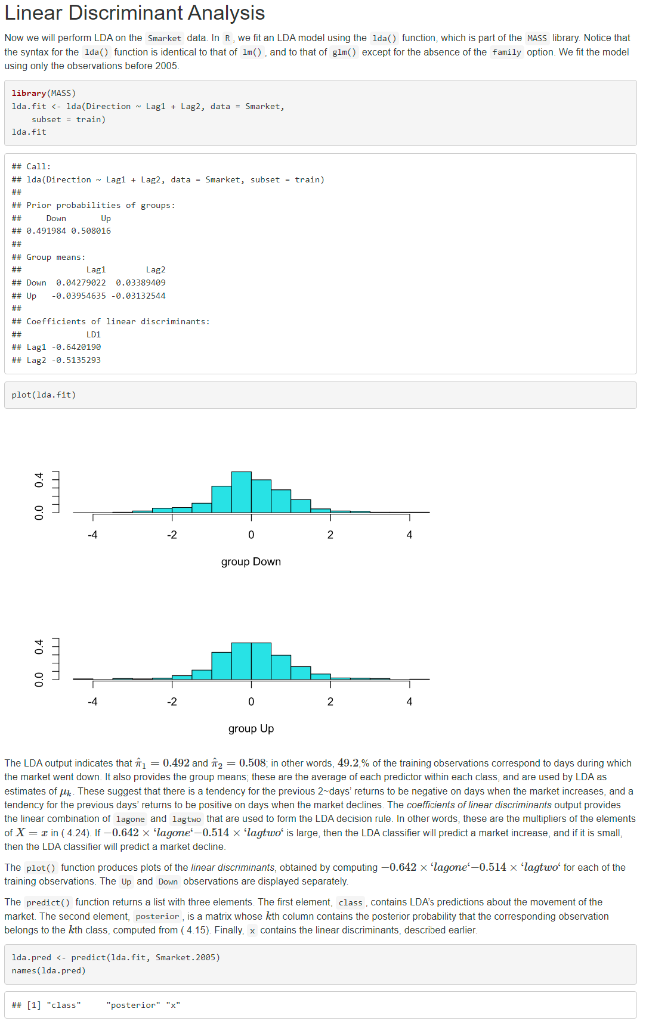
4.7.3 Linear Discriminant Analysis Submit: the screenshot of the confusion matrix (output of table() function) when the Smarket data is split into training (yearR, we fit an LDA model using the 1da() function, which is part of the Mass library. Notice that the syntax for the 1 da) function is identical to that of ln(), and to that of gln() except for the absence of the fanily option. We fit the model using only the observations before 2005 . The LDA output indicates that ^1=0.492 and ^2=0.508; in other words, 49.2% of the training observations correspond to days during which the market went down. It also provides the group means; these are the average of each predictor within each class, and are used by LDA as estimates of k. These suggest that there is a tendency for the previous 2 -days' returns to be negative on days when the market increases, and a tendency for the previous days' returns to be positive on days when the market declines. The coefficients of linear discriminanis output provides the linear combination of lagone and lagtwo that are used to form the LDA decision fule. In other words, these are the multipliers of the elements of X=x in (4.24). If 0.642 'lagome. 0.514 lagtuo' is large, then the LDA classifier will predict a market incrense, and if it is small, then the LDA classifier will predict a market decline. The plot() function produces plots of the linoar discnminants, obtained by computing 0.642lagonet0.514 'lagtwo' for each of the lag training observations. The Up and Down observations are displayed separately. The predtct() function returns a list with three elements. The first element, class, contains LDA's predictions about the movement of the market. The second element, posteriar, is a matrix whose kth column contains the posterior probability that the corresponding observation belongs to the kth class, computed from (4.15). Finally. x contains the linear discriminants, descrized earlier. lda.prod&-prodict(1da.fit,Smarket.205)names(1da.pred) f we wanted to use a posterior probability threshold other than 50,% in order to make predictions, then we could easily do so. For instance, suppose that we wish to predict a market decrease only if we are very certain that the market will indeed decrease on that day-say, if the oosterior probability is at least 90,%
Step by Step Solution
There are 3 Steps involved in it

Get step-by-step solutions from verified subject matter experts