

Question: R coding question: Initialize the scores of 100 students as shown below: scores a) Show the default histogram of the student scores. Using the counts
R coding question:
Initialize the scores of 100 students as shown below:
scores
a)Show the default histogram of the student scores. Using the counts and breaks property of this histogram, write the R code to produce the following output.
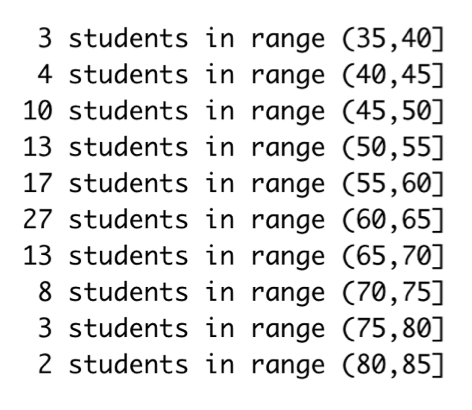
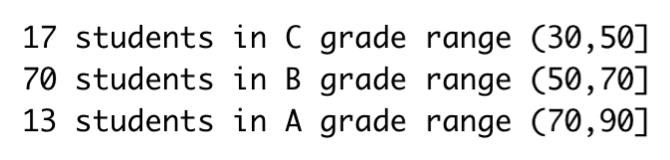
3 students in range (35,40] 4 students in range (40,45] 10 students in range (45,50] 13 students in range (50,55] 17 students in range (55, 60] 27 students in range (60, 65] 13 students in range (65, 70] 8 students in range (70,75] 3 students in range (75, 80] 2 students in range (80, 85]17 students in C grade range (30,501 70 students in B grade range (50,70] 13 students in A grade range (70,90]
Step by Step Solution
There are 3 Steps involved in it

Get step-by-step solutions from verified subject matter experts