

Question: R Programming (applies to probability and statistics) An attempt was made for the following requests of the problem. Check wether the solution for the first
R Programming (applies to probability and statistics)
An attempt was made for the following requests of the problem. Check wether the solution for the first two bullet points is correct (or makes sense) and build a R-code for the other requests (the last three bullet points).
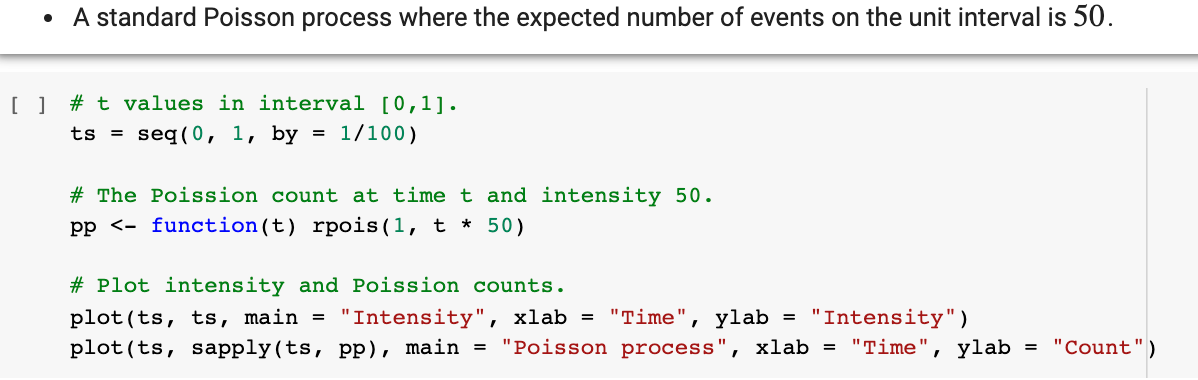
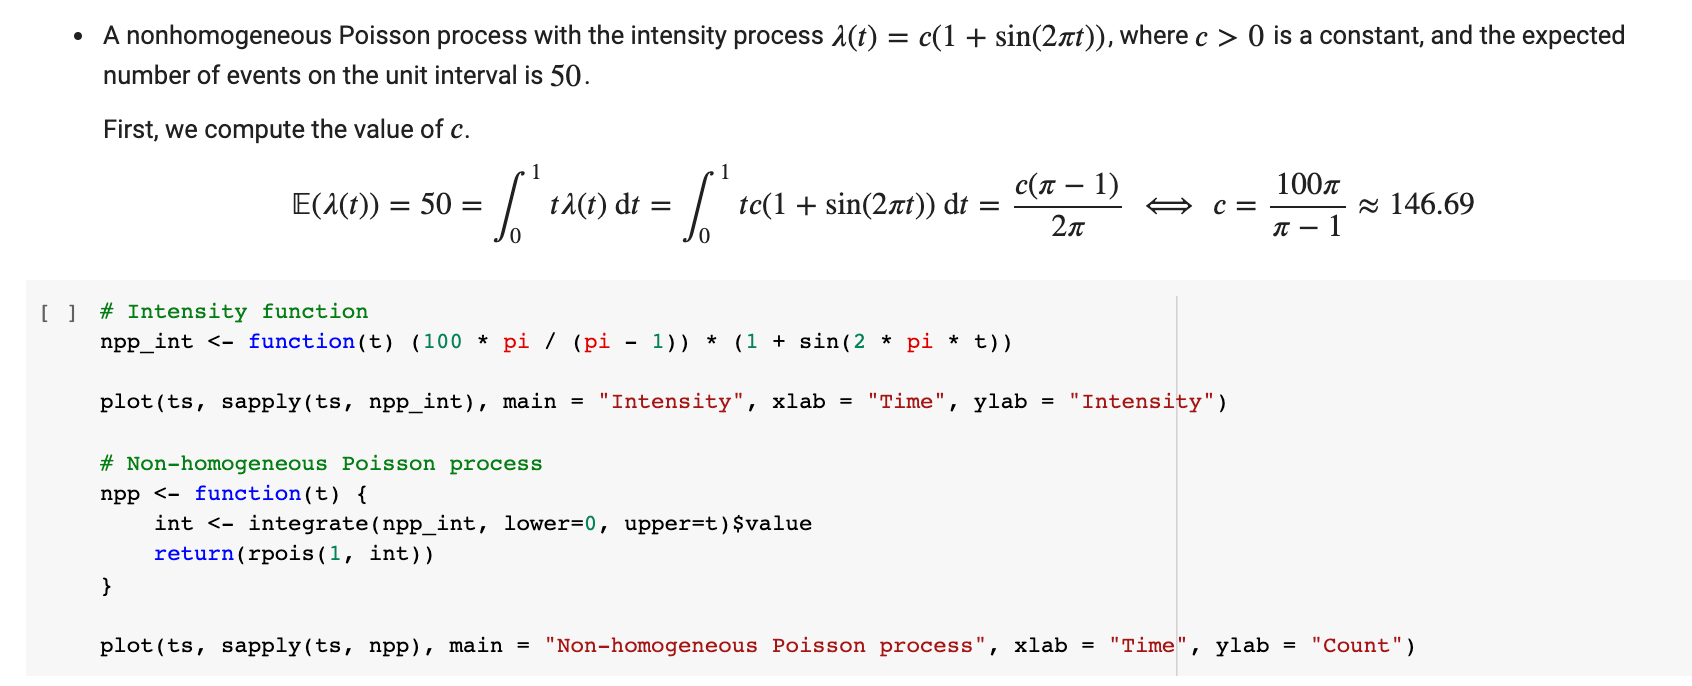
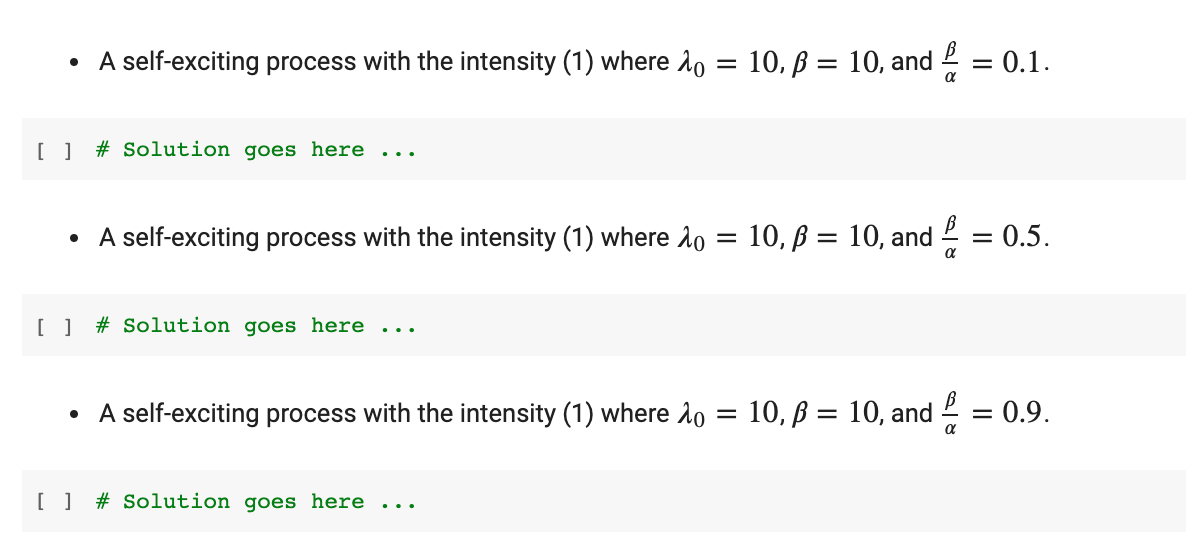
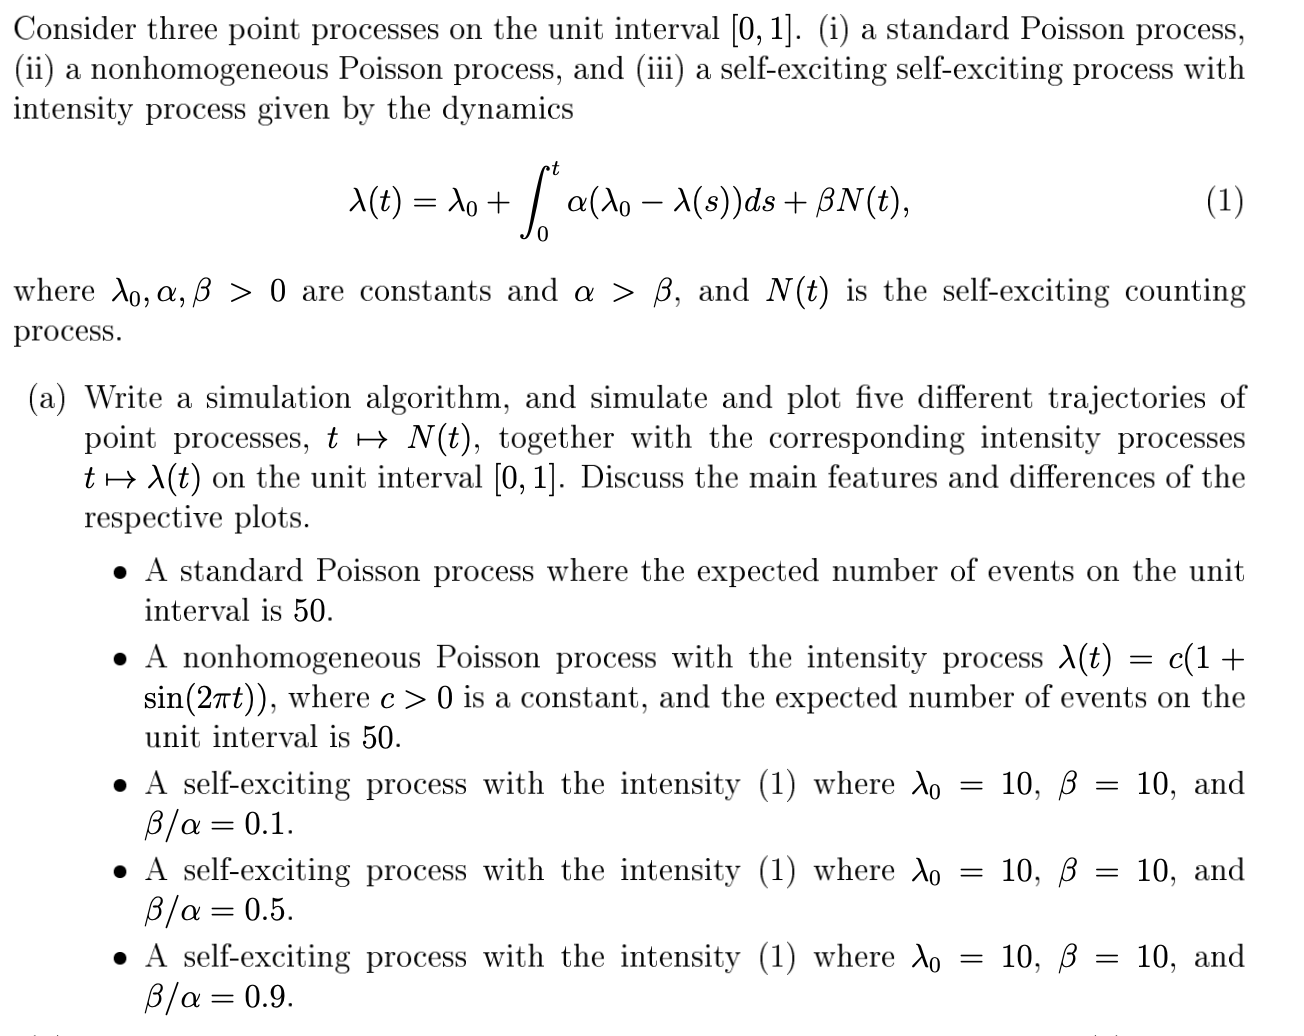
. A standard Poisson process where the expected number of events on the unit interval is 50. [ ] # t values in interval [0, 1]. ts = seq(0, 1, by = 1/100) # The Poission count at time t and intensity 50. pp 0 is a constant, and the expected number of events on the unit interval is 50. First, we compute the value of c. E(1(t) ) = 50 = / "tacnor - for tc(1 + sin(2xt)) dt = c(it - 1) C = 100 T - 1 ~ 146.69 [ ] # Intensity function npp_int 0 are constants and o: > 3, and N (t) is the self-exciting counting process. (a) Write a simulation algorithm, and simulate and plot ve different trajectories of point processes, t r> N (it), together with the correSponding intensity processes It I> Mt) on the unit interval [0, 1]. Discuss the main features and differences of the respective plots. I A standard Poisson process where the expected number of events on the unit interval is 50. o A nonhomogeneous Poisson process with the intensity process Mt) = c(1 + sin(27rt)), where c > 0 is a constant, and the expected number of events on the unit interval is 50. o A self-exciting process with the intensity (1) where A0 10, 13 = 10, and /a = 0.1. o A self-exciting process with the intensity (1) where A0 = 10, 3 = 10, and [3/03 = 0.5. o A self-exciting process with the intensity (1) where A0 = 10, 3 = 10, and /oz = 0.9
Step by Step Solution
There are 3 Steps involved in it

Get step-by-step solutions from verified subject matter experts