

Question: R Programming code : 1. Consider the following table where certain keywords from daily Twitter messages of stock bre and traders are collected, along with
R Programming code :
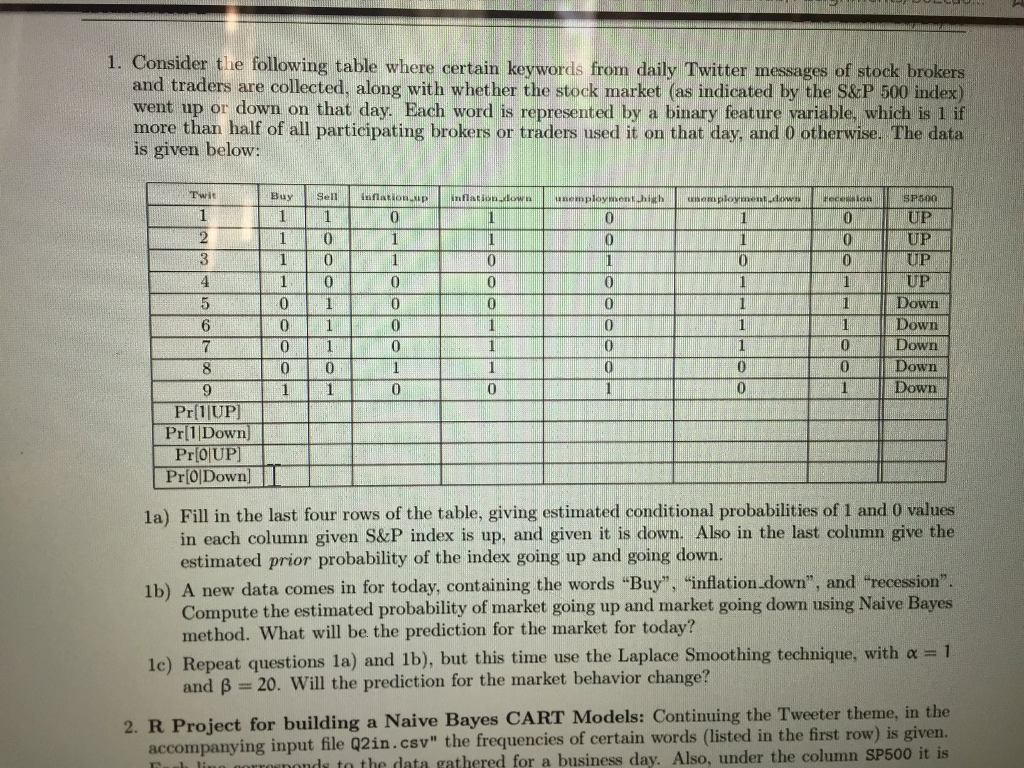
1. Consider the following table where certain keywords from daily Twitter messages of stock bre and traders are collected, along with whether the stock market (as indicated by the S&P 500 index) went up or down on that day. Each word is represented by a binary feature variable, which is 1 if more than half of all participating brokers or traders used it on that day, and 0 otherwise. The data is given below: Twit UP UP UP 0 1Down Down Down Down Down 0 0 6 0 0 Pr(1 UP] Pr 1 Down Pr[OUP) Pr[0DownI la) Fill in the last four rows of the table, giving estimated conditional probabilities of 1 and 0 values in each column given S&P index is up, and given it is down. Also in the last column give the estimated prior probability of the index going up and going down. 1b) A new data comes in for today, containing the words "Buy", "inflation down", and "recession". le) Repeat questions la) and 1b), but this time use the Laplace Smoothing technique, with a-1 2. R Project for building a Naive Bayes CART Models: Continuing the Tweeter theme, in th Compute the estimated probability of market going up and market going down using Naive Bayes method. What will be the prediction for the market for today? and B 20. Will the prediction for the market behavior change? accompanying input file Q2in.csv" the frequencies of certain words (listed in the first row) is given ls to the data gathered for a business day. Also, under the column SP500 it is 1. Consider the following table where certain keywords from daily Twitter messages of stock bre and traders are collected, along with whether the stock market (as indicated by the S&P 500 index) went up or down on that day. Each word is represented by a binary feature variable, which is 1 if more than half of all participating brokers or traders used it on that day, and 0 otherwise. The data is given below: Twit UP UP UP 0 1Down Down Down Down Down 0 0 6 0 0 Pr(1 UP] Pr 1 Down Pr[OUP) Pr[0DownI la) Fill in the last four rows of the table, giving estimated conditional probabilities of 1 and 0 values in each column given S&P index is up, and given it is down. Also in the last column give the estimated prior probability of the index going up and going down. 1b) A new data comes in for today, containing the words "Buy", "inflation down", and "recession". le) Repeat questions la) and 1b), but this time use the Laplace Smoothing technique, with a-1 2. R Project for building a Naive Bayes CART Models: Continuing the Tweeter theme, in th Compute the estimated probability of market going up and market going down using Naive Bayes method. What will be the prediction for the market for today? and B 20. Will the prediction for the market behavior change? accompanying input file Q2in.csv" the frequencies of certain words (listed in the first row) is given ls to the data gathered for a business day. Also, under the column SP500 it is
Step by Step Solution
There are 3 Steps involved in it

Get step-by-step solutions from verified subject matter experts