

Question: (R programming) Do the 5 steps for the hypothesis and the corresponding graph. Provide the script below Asignacion (Hacer los 5 pasos para la prueba
(R programming) Do the 5 steps for the hypothesis and the corresponding graph. Provide the script below
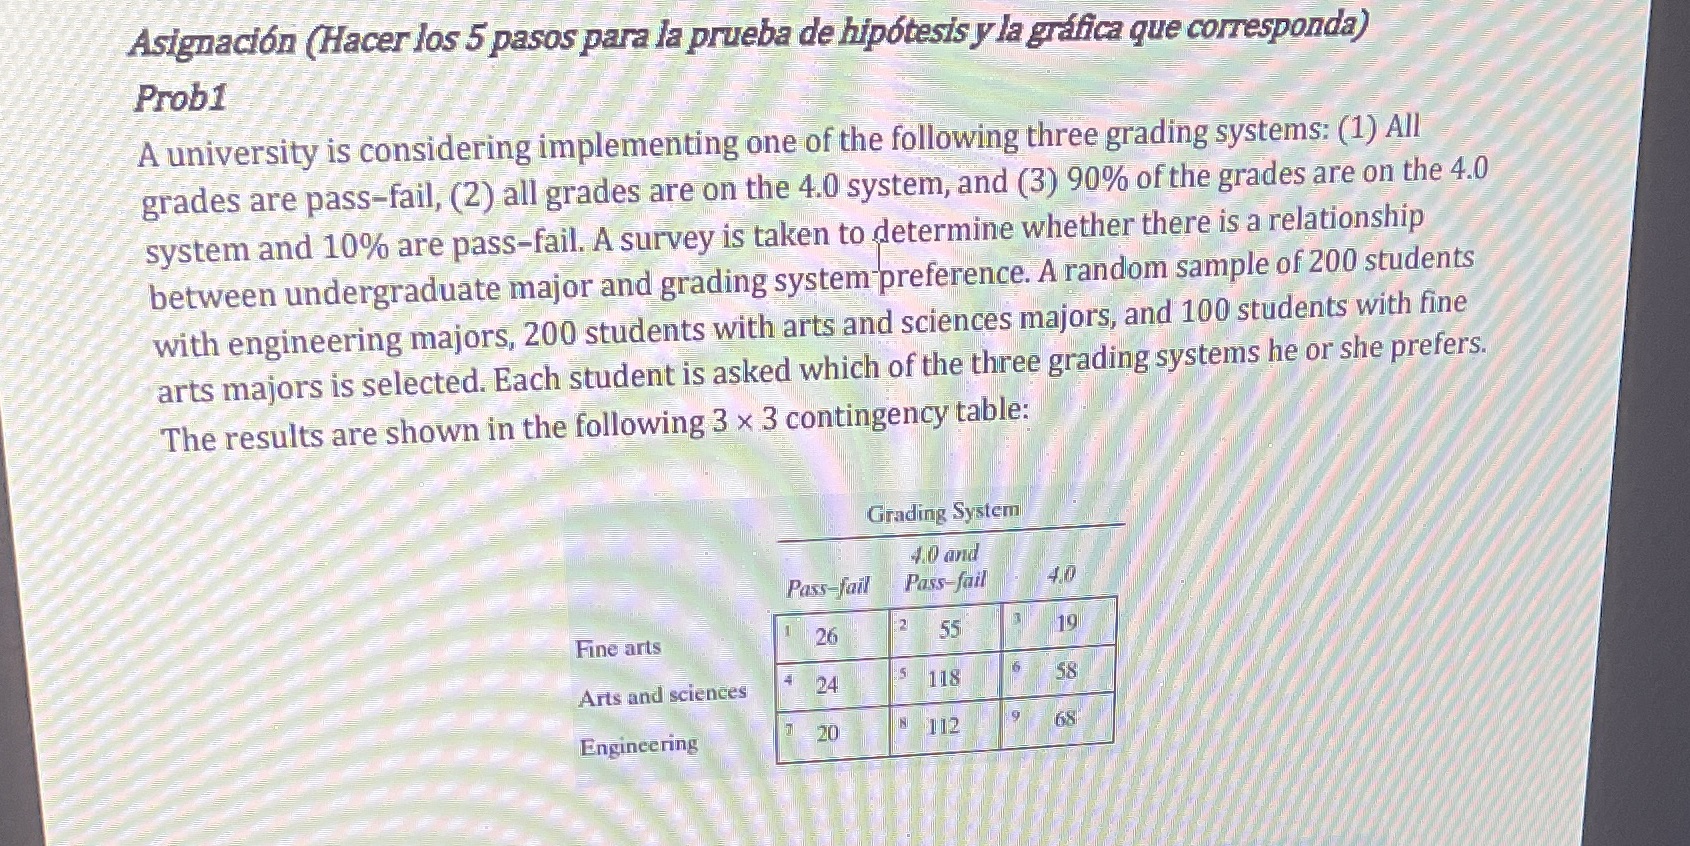
Asignacion (Hacer los 5 pasos para la prueba de hipotesis y la grafica que corresponda) Prob1 A university is considering implementing one of the following three grading systems: (1) All grades are pass-fail, (2) all grades are on the 4.0 system, and (3) 90% of the grades are on the 4.0 system and 10% are pass-fail. A survey is taken to determine whether there is a relationship between undergraduate major and grading system preference. A random sample of 200 students with engineering majors, 200 students with arts and sciences majors, and 100 students with fine arts majors is selected. Each student is asked which of the three grading systems he or she prefers. The results are shown in the following 3 x 3 contingency table: Grading System 40 and Pass-fail Pass-fail 2 Fine arts 26 55 19 Arts and sciences 24 118 58 68 Engineering 20 8 112
Step by Step Solution
There are 3 Steps involved in it

Get step-by-step solutions from verified subject matter experts