

Question: R programming question The data is global temparature changes from 1880 to 2020 (monthly). I successfully called the data from my computer and extract it,
R programming question 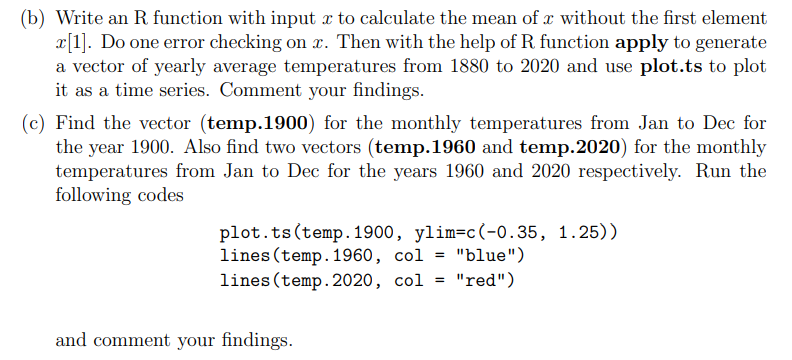
The data is global temparature changes from 1880 to 2020 (monthly). I successfully called the data from my computer and extract it, and I need to generating a vector of my row means from the function below.
df
#error checking if(!is.data.frame(x)){ stop("The input is not a data.frame form") } x = x[2:length(x)] # extract without the first column x = rowMeans(x) # calculate the mean of each rows }
I have created the function as above, but I have a trouble with generating vector with "apply()" which must be used. when I use apply() like below, it says dim(X) must have a positive length. apply(meanRow(df),MARGIN = 1, as.vector)
What should I do in here? and how can I create a time series plot with the year from the dataframe?
(b) Write an R function with input x to calculate the mean of x without the first element x[1]. Do one error checking on x. Then with the help of R function apply to generate a vector of yearly average temperatures from 1880 to 2020 and use plot.ts to plot it as a time series. Comment your findings. (c) Find the vector (temp.1900) for the monthly temperatures from Jan to Dec for the year 1900. Also find two vectors (temp.1960 and temp.2020) for the monthly temperatures from Jan to Dec for the years 1960 and 2020 respectively. Run the following codes plot.ts (temp. 1900, ylim=c(-0.35, 1.25)) lines (temp. 1960, col = "blue") lines (temp. 2020, col = "red") and comment your findings. (b) Write an R function with input x to calculate the mean of x without the first element x[1]. Do one error checking on x. Then with the help of R function apply to generate a vector of yearly average temperatures from 1880 to 2020 and use plot.ts to plot it as a time series. Comment your findings. (c) Find the vector (temp.1900) for the monthly temperatures from Jan to Dec for the year 1900. Also find two vectors (temp.1960 and temp.2020) for the monthly temperatures from Jan to Dec for the years 1960 and 2020 respectively. Run the following codes plot.ts (temp. 1900, ylim=c(-0.35, 1.25)) lines (temp. 1960, col = "blue") lines (temp. 2020, col = "red") and comment your findings
Step by Step Solution
There are 3 Steps involved in it

Get step-by-step solutions from verified subject matter experts