

Question: R Programming Question. Use the Mouse_DNA_methylation_Aging.csv generate a bar charts for all the data, the x- axis is the Age_Months with a name of Age
R Programming Question.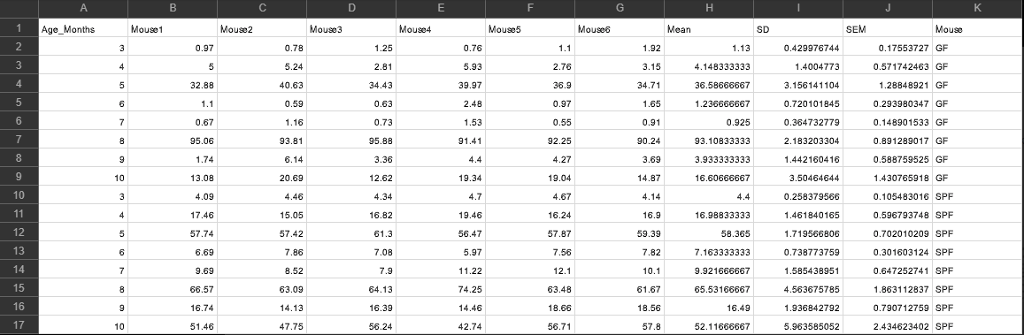
Use the Mouse_DNA_methylation_Aging.csv generate a bar charts for all the data, the x- axis is the Age_Months with a name of Age of the mice, the y-axis is the mean with a name of "Average DNA Methylation". The title of the chart is "DNA methylation level in GF and SPF mice at different age". The error bars are for the mean=+/-SEM. The background is clean without gray color or any grids.
Age Months Mouse1 Mouse2 Mouse3 Mouse4 Mouseo SEM 1.25 1.92 0.17553727 G 0.429976744 1.4004773 3.156141104 0.720101845 0.364732779 2.183203304 1.442160416 3.50464644 0.258379566 1.461840165 1.719566806 0.738773759 1.585438951 4.563675785 1.936842792 5.963585052 4.148333333 36.58666667 1.236666667 0.571742463 GF 1,28848921 GF 0.293980347 GF 0.148901533 GF 0.891289017 GF 0.588759525 GF 1.430765918 GF 0.105483016 SPF 0.596793748 SPF 0.702010209 SPF 0.301603124 SPF 0.647252741 SPF 1.863112837 SPF 0.790712759 SPF 2.434623402 SPF 34.43 0.63 0.73 95.88 39.97 2.48 1.53 91.41 0.59 0.97 1.65 95.06 93.81 90.24 93.10833333 3.933333333 16.60666667 92.25 3.69 19.34 13.08 4.09 17.46 57.74 6.69 9.69 66.57 16.74 12.62 19.04 4.67 15.05 16.82 16.98833333 56.47 57.87 59.39 7.82 11.22 74.25 14.46 42.74 61.67 18.56 57.8 7,163333333 9.921666667 65.53166667 16.49 52.11666667 63.09 63.48 18.66 56.71 56.24
Step by Step Solution
There are 3 Steps involved in it

Get step-by-step solutions from verified subject matter experts