

Question: R programming (R Studio) Generating data and advanced density plots (a) Create a data frame (or a tibble) named df with 500 rows and 4
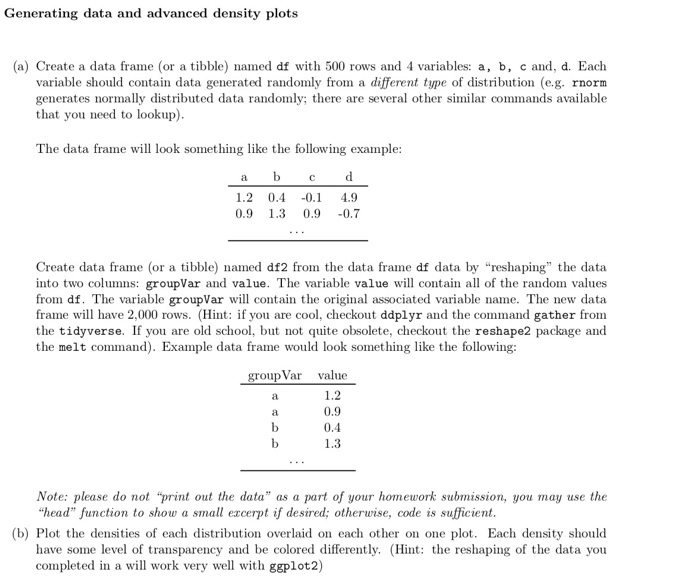
Generating data and advanced density plots (a) Create a data frame (or a tibble) named df with 500 rows and 4 variables: a, b, c and, d. Each variable should contain data generated randomly from a different type of distribution (e.g. rnorm generates normally distributed data randomly; there are several other similar commands available that you need to lookup) The data frame will look something like the following example: 1.2 0.4 0.1 4.9 0.9 1.3 0.9 -0.7 Create data frame (or a tibble) named df2 from the data frame df data by "reshaping" the data into two columns: groupVar and value. The variable value will contain all of the random values from df. The variable groupVar will contain the original associated variable name. The new data frame wil have 2,000 rows. (Hint: if you are cool, checkout ddplyr and the command gather from the tidyverse. If you are old school, but not quite obsolete, checkout the reshape2 package and the melt command). Example data frame would look something like the following: group Var value 1.2 0.9 0.4 1.3 Note: please do not "print out the data" as a part of your homework submission, you may use the "head" function to show a small excerpt if desired; otherwise, code is sufficient (b) Plot the densities of each distribution overlaid on each other on one plot. Each density should have some level of transparency and be colored differently. (Hit the reshaping of the data you completed in al work very well with ggplot2)
Step by Step Solution
There are 3 Steps involved in it

Get step-by-step solutions from verified subject matter experts