

Question: R programming. R studio. Just a question about my answer to this homework question. why are my plot hierachical clustering code lines not working? From
R programming. R studio.
Just a question about my answer to this homework question.
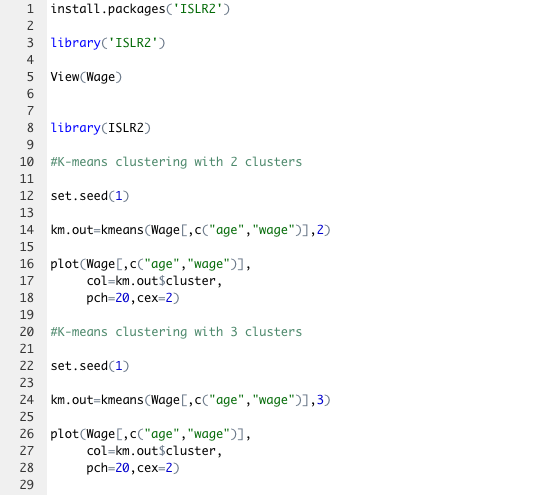
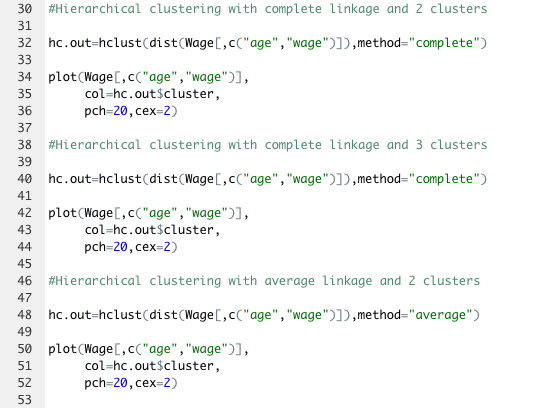
why are my plot hierachical clustering code lines not working? From row 30 down just creates an empty graph/figure each time when I run the plot function.
This is my code so far:
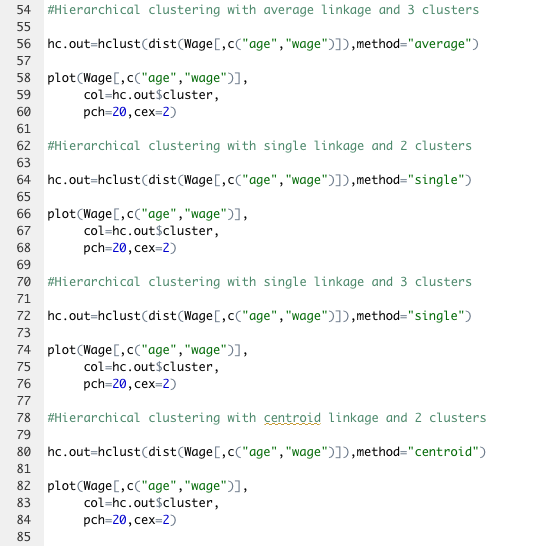
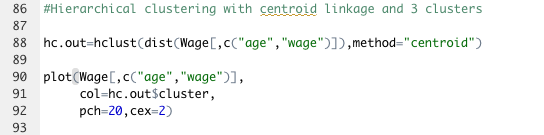
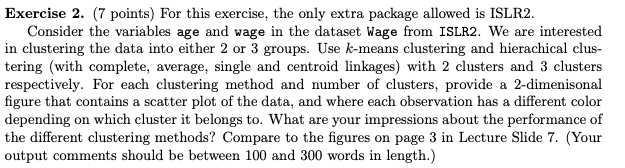
Exercise 2. (7 points) For this exercise, the only extra package allowed is ISLR2. Consider the variables age and wage in the dataset Wage from ISLR2. We are interested in clustering the data into either 2 or 3 groups. Use k-means clustering and hierachical clustering (with complete, average, single and centroid linkages) with 2 clusters and 3 clusters respectively. For each clustering method and number of clusters, provide a 2-dimenisonal figure that contains a scatter plot of the data, and where each observation has a different color depending on which cluster it belongs to. What are your impressions about the performance of the different clustering methods? Compare to the figures on page 3 in Lecture Slide 7. (Your output comments should be between 100 and 300 words in length.) #Hierarchical clustering with average linkage and 3 clusters hc. out=hclust(dist(Wage [, c("age", "wage")]), method=" average") plot (Wage [, c( "age", "wage")], col=hc. out \$cluster, pch=20, cex =2 ) #Hierarchical clustering with single linkage and 2 clusters hc. out=hclust (dist(Wage [, c("age", "wage")]), method="single") plot (Wage [, c( "age", "wage")], col=hc . out $ cluster, pch=20, cex =2 ) \#Hierarchical clustering with single linkage and 3 clusters hc. out=hclust (dist (Wage [, c("age", "wage")]), method="single") plot (Wage [, c ("age", "wage")], col=hc. out $ cluster, pch=20,cex=2 ) #Hierarchical clustering with centroid linkage and 2 clusters hc. out=hclust (dist (Wage [, c("age", "wage")]), method="centroid") plot (Wage [, c( "age", "wage")], col=hc. out $ cluster, pch=20,cex=2 ) #Hierarchical clustering with centroid linkage and 3 clusters hc. out=hclust (dist (Wage [, c("age", "wage")]), method="centroid") plot (Wage [, c ("age", "wage")], col=hc.out $ cluster, pch=20, cex=2) Exercise 2. (7 points) For this exercise, the only extra package allowed is ISLR2. Consider the variables age and wage in the dataset Wage from ISLR2. We are interested in clustering the data into either 2 or 3 groups. Use k-means clustering and hierachical clustering (with complete, average, single and centroid linkages) with 2 clusters and 3 clusters respectively. For each clustering method and number of clusters, provide a 2-dimenisonal figure that contains a scatter plot of the data, and where each observation has a different color depending on which cluster it belongs to. What are your impressions about the performance of the different clustering methods? Compare to the figures on page 3 in Lecture Slide 7. (Your output comments should be between 100 and 300 words in length.) #Hierarchical clustering with average linkage and 3 clusters hc. out=hclust(dist(Wage [, c("age", "wage")]), method=" average") plot (Wage [, c( "age", "wage")], col=hc. out \$cluster, pch=20, cex =2 ) #Hierarchical clustering with single linkage and 2 clusters hc. out=hclust (dist(Wage [, c("age", "wage")]), method="single") plot (Wage [, c( "age", "wage")], col=hc . out $ cluster, pch=20, cex =2 ) \#Hierarchical clustering with single linkage and 3 clusters hc. out=hclust (dist (Wage [, c("age", "wage")]), method="single") plot (Wage [, c ("age", "wage")], col=hc. out $ cluster, pch=20,cex=2 ) #Hierarchical clustering with centroid linkage and 2 clusters hc. out=hclust (dist (Wage [, c("age", "wage")]), method="centroid") plot (Wage [, c( "age", "wage")], col=hc. out $ cluster, pch=20,cex=2 ) #Hierarchical clustering with centroid linkage and 3 clusters hc. out=hclust (dist (Wage [, c("age", "wage")]), method="centroid") plot (Wage [, c ("age", "wage")], col=hc.out $ cluster, pch=20, cex=2)
Step by Step Solution
There are 3 Steps involved in it

Get step-by-step solutions from verified subject matter experts