

Question: R programming (RStudio) Principal components for dimension reduction The HSAUR2 package contains the data heptathlon which are the results of the women's olympic hep- tathlon
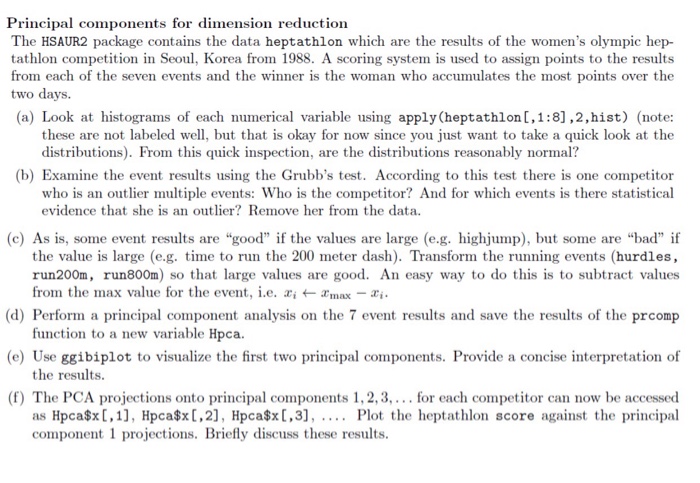
Principal components for dimension reduction The HSAUR2 package contains the data heptathlon which are the results of the women's olympic hep- tathlon competition in Seou, Korea from 1988. A scoring system is used to assign points to the results from each of the seven events and the winner is the woman who accumulates the most points over the two days. (a) Look at histograms of each numerical variable sig apply(heptathlon [,1:8],2,hist) (note: these are not labeled well, but that is okay for now since you just want to take a quick look at the distributions). From this quick inspection, are the distributions reasonably normal? (b) Examine the event results using the Grubb's test. According to this test there is one competitor who is an outlier multiple events: Who is the competitor? And for which events is there statistical evidence that she is an outlier? Remove her from the data (c) As is, some event results are "good" if the values are large (e.g. highjump), but some are "bad" if the value is large (e.g. time to run the 200 meter dash). Transform the running events (hurdles, run200m, run800m) so that large values are good. An easy way to do this is to subtract values from the max value for the event, i.e. ri Imax-i function to a new variable Hpca. the results. (d) Perform a principal component analysis on the 7 event results and save the results of the prcomp (e) Use ggibiplot to visualize the first two principal components. Provide a concise interpretation of (f) The PCA projections onto principal components 1,2,3,...for each competitor can now be accessed as Hpca$x ,1, Hpca$x [,2], Hpca$x [,3], Plot the heptathlon score against the principal component 1 projections. Briefly discuss the ese results. Principal components for dimension reduction The HSAUR2 package contains the data heptathlon which are the results of the women's olympic hep- tathlon competition in Seou, Korea from 1988. A scoring system is used to assign points to the results from each of the seven events and the winner is the woman who accumulates the most points over the two days. (a) Look at histograms of each numerical variable sig apply(heptathlon [,1:8],2,hist) (note: these are not labeled well, but that is okay for now since you just want to take a quick look at the distributions). From this quick inspection, are the distributions reasonably normal? (b) Examine the event results using the Grubb's test. According to this test there is one competitor who is an outlier multiple events: Who is the competitor? And for which events is there statistical evidence that she is an outlier? Remove her from the data (c) As is, some event results are "good" if the values are large (e.g. highjump), but some are "bad" if the value is large (e.g. time to run the 200 meter dash). Transform the running events (hurdles, run200m, run800m) so that large values are good. An easy way to do this is to subtract values from the max value for the event, i.e. ri Imax-i function to a new variable Hpca. the results. (d) Perform a principal component analysis on the 7 event results and save the results of the prcomp (e) Use ggibiplot to visualize the first two principal components. Provide a concise interpretation of (f) The PCA projections onto principal components 1,2,3,...for each competitor can now be accessed as Hpca$x ,1, Hpca$x [,2], Hpca$x [,3], Plot the heptathlon score against the principal component 1 projections. Briefly discuss the ese results
Step by Step Solution
There are 3 Steps involved in it

Get step-by-step solutions from verified subject matter experts