

Question: R programming: using lapply(), sapply(), tapply(), str(), summary() Consider the dataset found at http://www.math.hope.edu/isi/data/chap6/Tuna.txt The data contains measurements (in parts per million, or ppm) on
R programming: using lapply(), sapply(), tapply(), str(), summary()
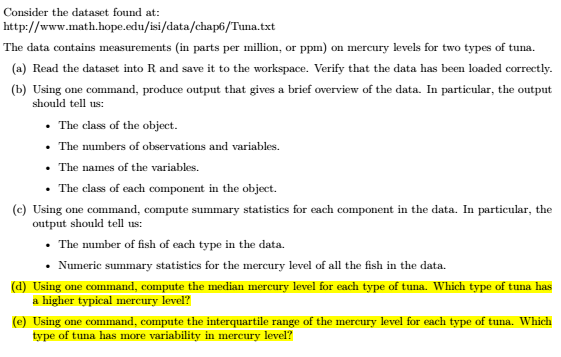
Consider the dataset found at http://www.math.hope.edu/isi/data/chap6/Tuna.txt The data contains measurements (in parts per million, or ppm) on mercury levels for two types of tuna. (a) Read the dataset into R and save it to the workspace. Verify that the data has been loaded correctly. (b) Using one command, produce output that gives a brief overview of the data. In particular, the output should tell us: The class of the object The mbers of observations and variables .The names of the variables. .The class of each component in the object. (c) Using one command, compute summary statistics for each component in the data. In particular, the output should tell us: The nmber of fish of each type in the data. Numeric summary statistics for the mercury level of all the fish in the data (d) Using one command, compute the median mercury level for each type of tuna. Which type of tuna has a higher typical mercury level? (e) Using one command, compute the interquartile range of the mercury level for each type of tuna. Which type of tuna has more variability in mercury level? Consider the dataset found at http://www.math.hope.edu/isi/data/chap6/Tuna.txt The data contains measurements (in parts per million, or ppm) on mercury levels for two types of tuna. (a) Read the dataset into R and save it to the workspace. Verify that the data has been loaded correctly. (b) Using one command, produce output that gives a brief overview of the data. In particular, the output should tell us: The class of the object The mbers of observations and variables .The names of the variables. .The class of each component in the object. (c) Using one command, compute summary statistics for each component in the data. In particular, the output should tell us: The nmber of fish of each type in the data. Numeric summary statistics for the mercury level of all the fish in the data (d) Using one command, compute the median mercury level for each type of tuna. Which type of tuna has a higher typical mercury level? (e) Using one command, compute the interquartile range of the mercury level for each type of tuna. Which type of tuna has more variability in mercury level
Step by Step Solution
There are 3 Steps involved in it

Get step-by-step solutions from verified subject matter experts