

Question: R Project 0 2 : Data Frame / Data Preparation / Data Mining Please download the R file R Project 0 2 . R .
R Project : Data FrameData PreparationData Mining
Please download the R file R Project R
Please download the data files: Pokeman Data.csvPokemon Info.csv and Diabetes
Data.csv
Please write down your code in the file and submit the file in the submission box.
Section one: Pokmon
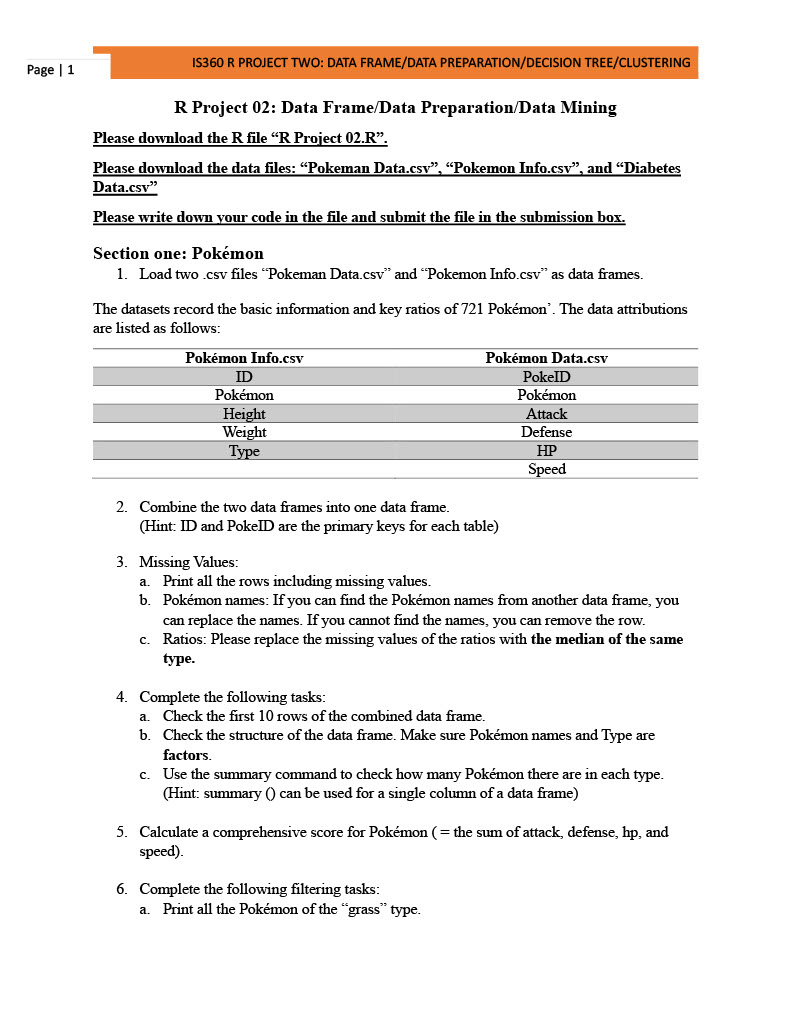
Load two csv files Pokeman Data.csv and Pokemon Info.csv as data frames.
The datasets record the basic information and key ratios of Pokmon The data attributions
are listed as follows:
Pokmon Info.csv Pokmon Data.csv
ID PokeID
Pokmon Pokmon
Height Attack
Weight Defense
Type HP
Speed
Combine the two data frames into one data frame.
Hint: ID and PokeID are the primary keys for each table
Missing Values:
a Print all the rows including missing values.
b Pokmon names: If you can find the Pokmon names from another data frame, you
can replace the names. If you cannot find the names, you can remove the row.
c Ratios: Please replace the missing values of the ratios with the median of the same
type.
Complete the following tasks:
a Check the first rows of the combined data frame.
b Check the structure of the data frame. Make sure Pokmon names and Type are
factors.
c Use the summary command to check how many Pokmon there are in each type.
Hint: summary can be used for a single column of a data frame
Calculate a comprehensive score for Pokmon the sum of attack, defense, hp and
speed
Complete the following filtering tasks:
a Print all the Pokmon of the grass type.
b Print all the Pokmon have an attack score larger than or equal to and less than
or equal to
c Print all the Pokmon of the grass type and have a height larger than or equal to
d Print the data for pichu
R Project : Data FrameData PreparationData Mining
Please download the R file R Project R
Please download the data files: "Pokeman Data.csv "Pokemon Info.csv and "Diabetes
Data.csv
Please write down your code in the file and submit the file in the submission box.
Section one: Pokmon
Load two csv files "Pokeman Data.csv and "Pokemon Info.csv as data frames.
The datasets record the basic information and key ratios of Pokmon The data attributions are listed as follows:
Combine the two data frames into one data frame.
Hint: ID and PokeID are the primary keys for each table
Missing Values:
a Print all the rows including missing values.
b Pokmon names: If you can find the Pokmon names from another data frame, you can replace the names. If you cannot find the names, you can remove the row.
c Ratios: Please replace the missing values of the ratios with the median of the same type.
Complete the following tasks:
a Check the first rows of the combined data frame.
b Check the structure of the data frame. Make sure Pokmon names and Type are factors.
c Use the summary command to check how many Pokmon there are in each type. Hint: summary can be used for a single column of a data frame
Calculate a comprehensive score for Pokmon the sum of attack, defense, hp and speed
Complete the following filtering tasks:
a Print all the Pokmon of the "grass" type.
b Print all the Pokmon have an "attack" score larger than or equal to and less than or equal to
c Print all the Pokmon of the "grass" type and have a height larger than or equal to
d Print the data for "pichu".
Section Two: Diabetes Data
This dataset is originally from the National Institute of Diabetes and Digestive and Kidney Diseases. The objective of the dataset is to diagnostically predict whether or not a patient has diabetes based on certain diagnostic measurements included in the dataset. In particular, all patients here are females at least years old of Pima Indian heritage. The attributions are listed as follows:
Load the. csv file "Diabetes Data.csv as a data frame
Data PreparationMissing Values:
a Check the summary and structure of the data
b Encode the target variable as a factor
Data Splitting:
a Split the dataset into the training set and testing set
b Pick the variable needed: "Age", "BMI", "Glucose", and "Outcome"
Decision Tree Classification:
a Fitting Decision Tree Classification to the Training set
b Plotting the tree
Assess the model:
a Predicting the Test set results
b Making the Confusion Matrix
c Calculate the accuracy ratios
Pick the variable needed for clustering analysis: "Age" and "BMI"
Using the Elbow Method to find the optimal number of cluster
Run the clustering analysis
Print the results in the plot color the clusters
Step by Step Solution
There are 3 Steps involved in it
1 Expert Approved Answer
Step: 1 Unlock

Question Has Been Solved by an Expert!
Get step-by-step solutions from verified subject matter experts
Step: 2 Unlock
Step: 3 Unlock