

Question: R studio # 2. Repeat problem 1, but using a sample of size $n=60$ from a chi-square distribution with $0.2$ degree of freedom (note that
 R studio
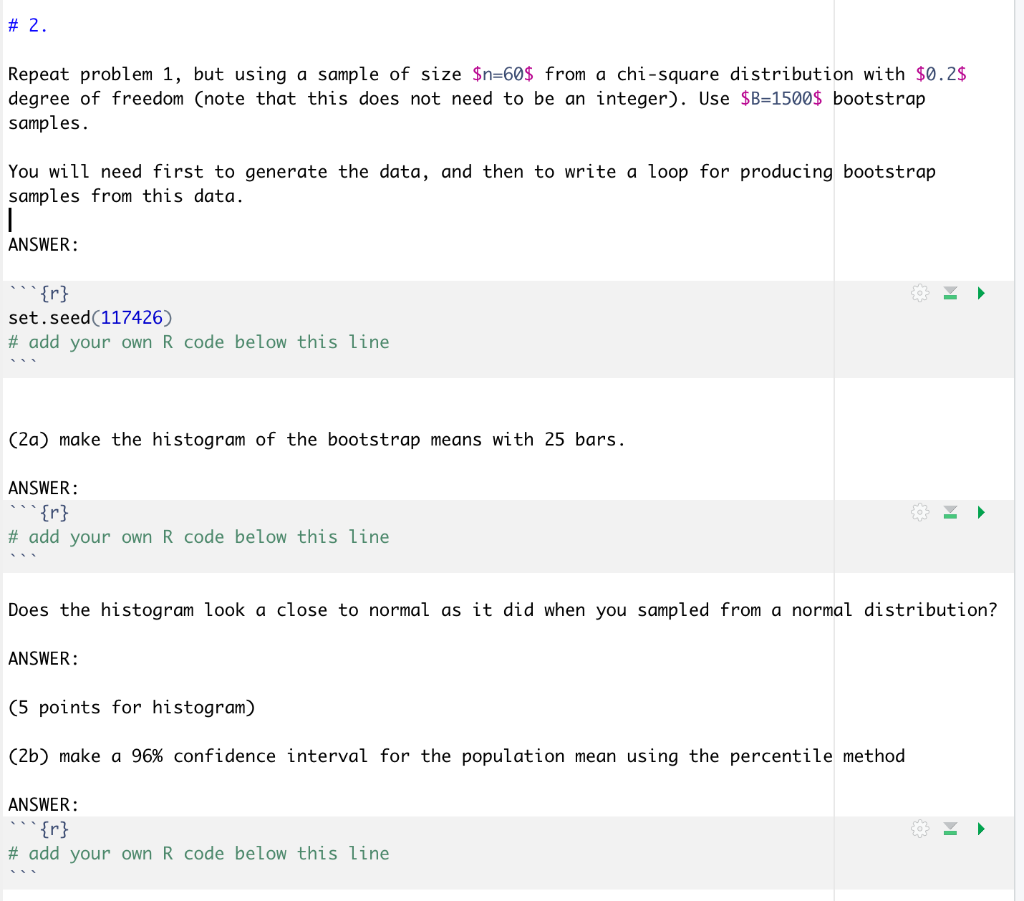
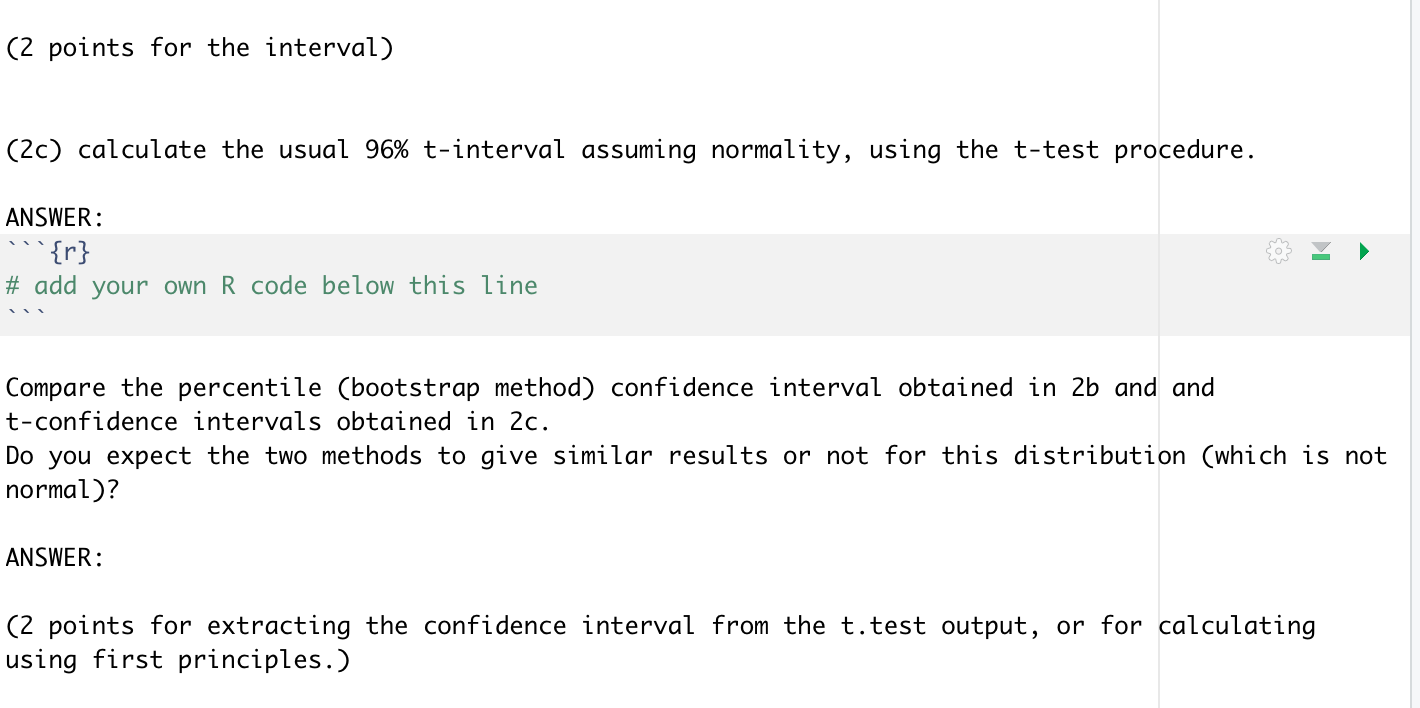
# 2. Repeat problem 1, but using a sample of size $n=60$ from a chi-square distribution with $0.2$ degree of freedom (note that this does not need to be an integer). Use $B=1500$ bootstrap samples. You will need first to generate the data, and then to write a loop for producing bootstrap samples from this data. ANSWER: "{r} set.seed (117426) # add your own R code below this line (2a) make the histogram of the bootstrap means with 25 bars. ANSWER: # add your own R code below this line Does the histogram look a close to normal as it did when you sampled from a normal distribution? ANSWER: (5 points for histogram) (2b) make a 96% confidence interval for the population mean using the percentile method ANSWER: ''{r} # add your own R code below this line (2 points for the interval) (2c) calculate the usual 96% t-interval assuming normality, using the t-test procedure. ANSWER: {r} # add your own R code below this line Compare the percentile (bootstrap method) confidence interval obtained in 2b and and t-confidence intervals obtained in 2c. Do you expect the two methods to give similar results or not for this distribution (which is not normal)? ANSWER: (2 points for extracting the confidence interval from the t.test output, or for calculating using first principles.) # 2. Repeat problem 1, but using a sample of size $n=60$ from a chi-square distribution with $0.2$ degree of freedom (note that this does not need to be an integer). Use $B=1500$ bootstrap samples. You will need first to generate the data, and then to write a loop for producing bootstrap samples from this data. ANSWER: "{r} set.seed (117426) # add your own R code below this line (2a) make the histogram of the bootstrap means with 25 bars. ANSWER: # add your own R code below this line Does the histogram look a close to normal as it did when you sampled from a normal distribution? ANSWER: (5 points for histogram) (2b) make a 96% confidence interval for the population mean using the percentile method ANSWER: ''{r} # add your own R code below this line (2 points for the interval) (2c) calculate the usual 96% t-interval assuming normality, using the t-test procedure. ANSWER: {r} # add your own R code below this line Compare the percentile (bootstrap method) confidence interval obtained in 2b and and t-confidence intervals obtained in 2c. Do you expect the two methods to give similar results or not for this distribution (which is not normal)? ANSWER: (2 points for extracting the confidence interval from the t.test output, or for calculating using first principles.)
Step by Step Solution
There are 3 Steps involved in it

Get step-by-step solutions from verified subject matter experts