

Question: R STUDIO PLEASE I NEED HELP WITH THESE 2 QUESTIONS: DATASET COW DEFOREST DEM -19 NA NA -19 NA NA -19 NA 10 2 NA
R STUDIO
PLEASE I NEED HELP WITH THESE 2 QUESTIONS:
DATASET
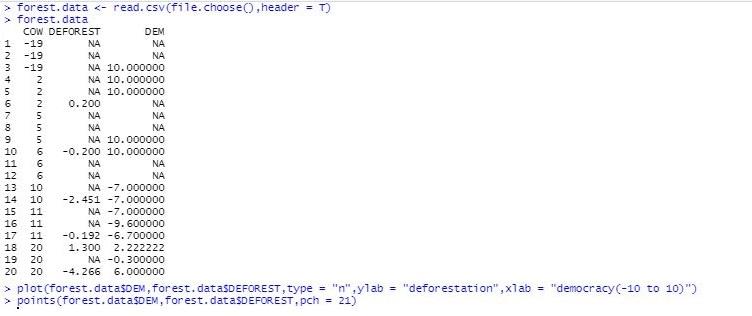
| COW | DEFOREST | DEM |
| -19 | NA | NA |
| -19 | NA | NA |
| -19 | NA | 10 |
| 2 | NA | 10 |
| 2 | NA | 10 |
| 2 | 0.2 | NA |
| 5 | NA | NA |
| 5 | NA | NA |
| 5 | NA | 10 |
| 6 | -0.2 | 10 |
| 6 | NA | NA |
| 6 | NA | NA |
| 10 | NA | -7 |
| 10 | -2.451 | -7 |
| 11 | NA | -7 |
| 11 | NA | -9.6 |
| 11 | -0.192 | -6.7 |
| 20 | 1.3 | 2.222222 |
| 20 | NA | -0.3 |
| 20 | -4.266 | 6 |
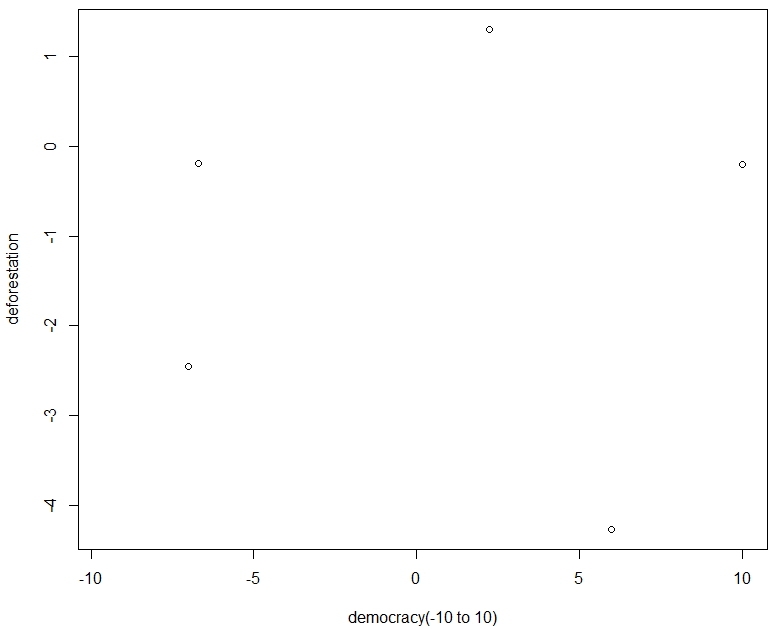
(a) Use a scatterplot to examine the relationship between democracy and deforestation. What model do you recommend to describe this relationship? Why
(b) Fit a spline model to the data and discuss the results.
(c) Fit logarithmic models.
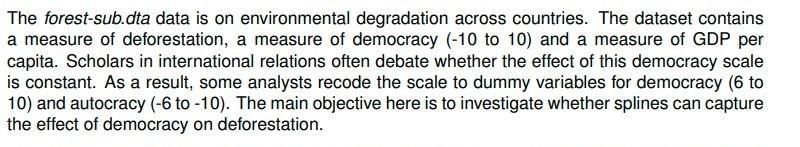
The forest-sub.dta data is on environmental degradation across countries. The dataset contains a measure of deforestation, a measure of democracy (-10 to 10) and a measure of GDP per capita. Scholars in international relations often debate whether the effect of this democracy scale is constant. As a result, some analysts recode the scale to dummy variables for democracy (6 to 10) and autocracy (-6 to -10). The main objective here is to investigate whether splines can capture the effect of democracy on deforestation. 866 RRRBONOWN > forest. data forest. data COW DEFOREST DEM -19 NA NA 2-19 NA NA -19 NA 10.000000 2 NA 10.000000 2 NA 10.000000 2 0.200 NA NA NA NA NA NA 10.000000 10 6 -0.200 10.000000 11 NA NA 12 NA NA 13 10 NA -7.000000 14 10 -2.451 -7.000000 15 11 NA -7.000000 16 11 NA -9.600000 17 11 -0.192 -6.700000 20 1.300 2.222222 20 NA -0.300000 20 -4.266 6.000000 > plot(Forest.dataDEM, Forest.dataSDEFOREST, type = "n", ylab = "deforestation",xlab = "democracy(-10 to 10)") > points(forest.data SDEM, forest. dataDEFOREST Pch = 21) SPR560 ) VI UTVINN 0 o 0 o -1 deforestation -2 O -3 4 0 -10 -5 0 5 10 democracy(-10 to 10) The forest-sub.dta data is on environmental degradation across countries. The dataset contains a measure of deforestation, a measure of democracy (-10 to 10) and a measure of GDP per capita. Scholars in international relations often debate whether the effect of this democracy scale is constant. As a result, some analysts recode the scale to dummy variables for democracy (6 to 10) and autocracy (-6 to -10). The main objective here is to investigate whether splines can capture the effect of democracy on deforestation. 866 RRRBONOWN > forest. data forest. data COW DEFOREST DEM -19 NA NA 2-19 NA NA -19 NA 10.000000 2 NA 10.000000 2 NA 10.000000 2 0.200 NA NA NA NA NA NA 10.000000 10 6 -0.200 10.000000 11 NA NA 12 NA NA 13 10 NA -7.000000 14 10 -2.451 -7.000000 15 11 NA -7.000000 16 11 NA -9.600000 17 11 -0.192 -6.700000 20 1.300 2.222222 20 NA -0.300000 20 -4.266 6.000000 > plot(Forest.dataDEM, Forest.dataSDEFOREST, type = "n", ylab = "deforestation",xlab = "democracy(-10 to 10)") > points(forest.data SDEM, forest. dataDEFOREST Pch = 21) SPR560 ) VI UTVINN 0 o 0 o -1 deforestation -2 O -3 4 0 -10 -5 0 5 10 democracy(-10 to 10)Step by Step Solution
There are 3 Steps involved in it
1 Expert Approved Answer
Step: 1 Unlock

Question Has Been Solved by an Expert!
Get step-by-step solutions from verified subject matter experts
Step: 2 Unlock
Step: 3 Unlock