Question: R studio solution is required. Problem 5. Commercial Properties. (20 pts) A commercial real estate company eval- uates vacancy rates, square footage, rental rates, and
R studio solution is required.
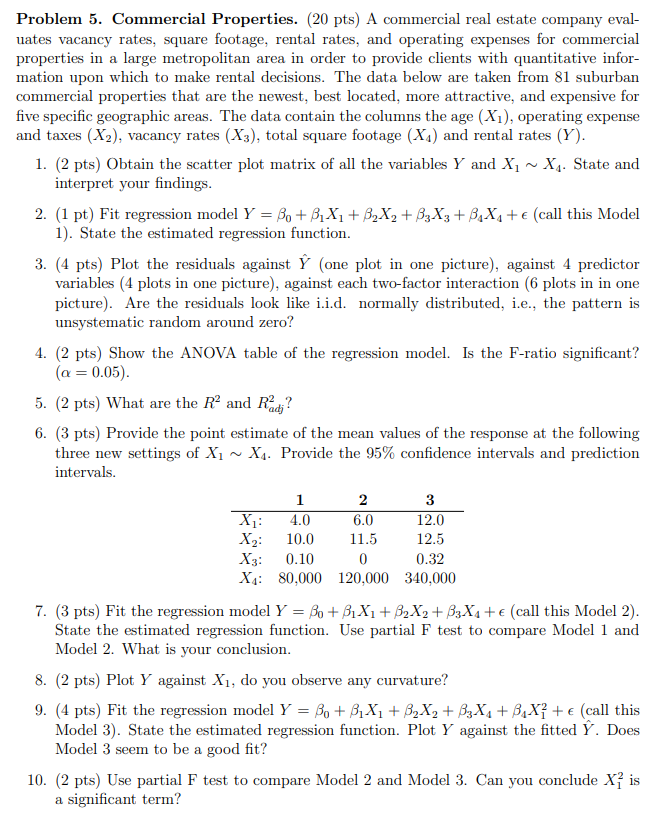
Problem 5. Commercial Properties. (20 pts) A commercial real estate company eval- uates vacancy rates, square footage, rental rates, and operating expenses for commercial properties in a large metropolitan area in order to provide clients with quantitative infor- mation upon which to make rental decisions. The data below are taken from 81 suburban commercial properties that are the newest, best located, more attractive, and expensive for five specific geographic areas. The data contain the columns the age (X1), operating expense and taxes (X2), vacancy rates (X3), total square footage (X4) and rental rates (Y). 1. (2 pts) Obtain the scatter plot matrix of all the variables Y and X] ~ X4. State and interpret your findings. 2. (1 pt) Fit regression model Y = Po + BjXi + 82X2 + ByX3 + B.X4 +e (call this Model 1). State the estimated regression function. 3. (4 pts) Plot the residuals against Y (one plot in one picture), against 4 predictor variables (4 plots in one picture), against each two-factor interaction (6 plots in in one picture). Are the residuals look like i.i.d. normally distributed, i.e., the pattern is unsystematic random around zero? 4. (2 pts) Show the ANOVA table of the regression model. Is the F-ratio significant? (a = 0.05). 5. (2 pts) What are the R2 and Rad? 6. (3 pts) Provide the point estimate of the mean values of the response at the following three new settings of X1 ~ X4. Provide the 95% confidence intervals and prediction intervals. 1 2 3 X1: 4.0 6.0 12.0 X2: 10.0 11.5 12.5 X3: 0.10 0 0.32 X4: 80,000 120,000 340,000 7. (3 pts) Fit the regression model Y = So + BIXi + 82X2 + 83X4 +e (call this Model 2). State the estimated regression function. Use partial F test to compare Model 1 and Model 2. What is your conclusion. 8. (2 pts) Plot Y against X1, do you observe any curvature? 9. (4 pts) Fit the regression model Y = So + 81X1+ 82X2 + 83X4 + BX? +e (call this Model 3). State the estimated regression function. Plot Y against the fitted Y. Does Model 3 seem to be a good fit? 10. (2 pts) Use partial F test to compare Model 2 and Model 3. Can you conclude X? is a significant term
Step by Step Solution
There are 3 Steps involved in it
1 Expert Approved Answer
Step: 1 Unlock
Question Has Been Solved by an Expert!
Get step-by-step solutions from verified subject matter experts
Step: 2 Unlock
Step: 3 Unlock
Students Have Also Explored These Related Accounting Questions!