

Question: R=1.54lb begin{tabular}{cccc} hline Sample & Mean Factor, & Upper Range, & Lower Range, Size, n & A2 & D4 & D3 hline 2

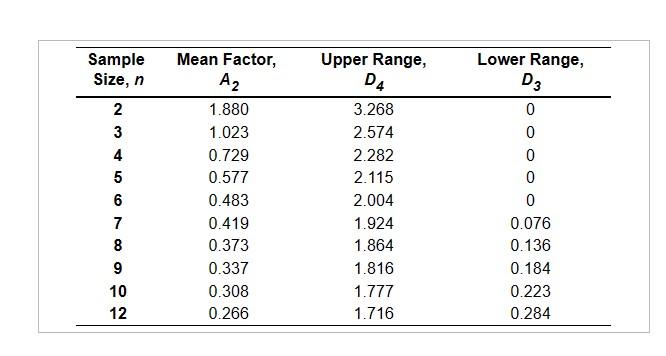
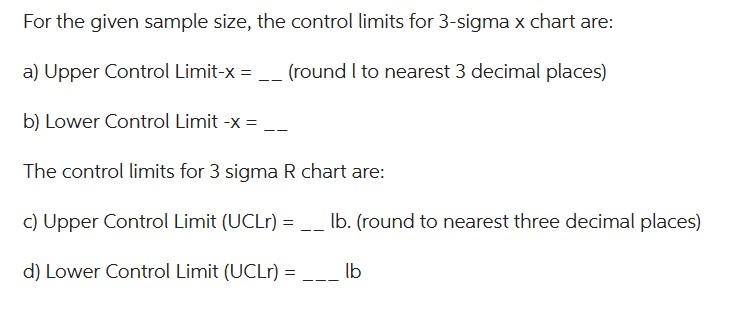
R=1.54lb \begin{tabular}{cccc} \hline Sample & Mean Factor, & Upper Range, & Lower Range, \\ Size, n & A2 & D4 & D3 \\ \hline 2 & 1.880 & 3.268 & 0 \\ 3 & 1.023 & 2.574 & 0 \\ 4 & 0.729 & 2.282 & 0 \\ 5 & 0.577 & 2.115 & 0 \\ 6 & 0.483 & 2.004 & 0 \\ 7 & 0.419 & 1.924 & 0.076 \\ 8 & 0.373 & 1.864 & 0.136 \\ 9 & 0.337 & 1.816 & 0.184 \\ 10 & 0.308 & 1.777 & 0.223 \\ 12 & 0.266 & 1.716 & 0.284 \\ \hline \end{tabular} For the given sample size, the control limits for 3 -sigma x chart are: a) Upper Control Limit- = (round I to nearest 3 decimal places) b) Lower Control Limit x= The control limits for 3 sigma R chart are: c) Upper Control Limit (UCLr)= lb. (round to nearest three decimal places) d) Lower Control Limit (UCLr)= lb
Step by Step Solution
There are 3 Steps involved in it

Get step-by-step solutions from verified subject matter experts