Question: Rall efficiency analysis case study: 1. See the attached chart of operating results for Amtrak. Figure 2.Amtrak Ratio of Revenues to Expenses, 1995-2016 (total revenues/total
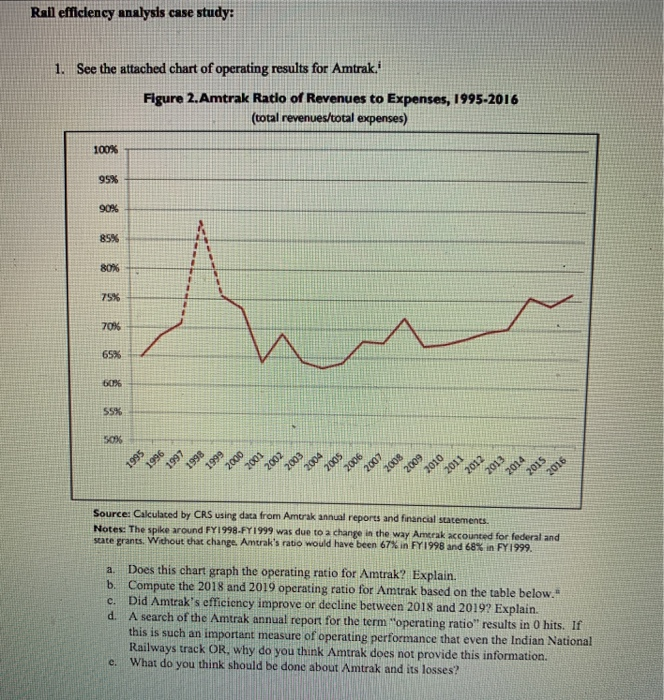
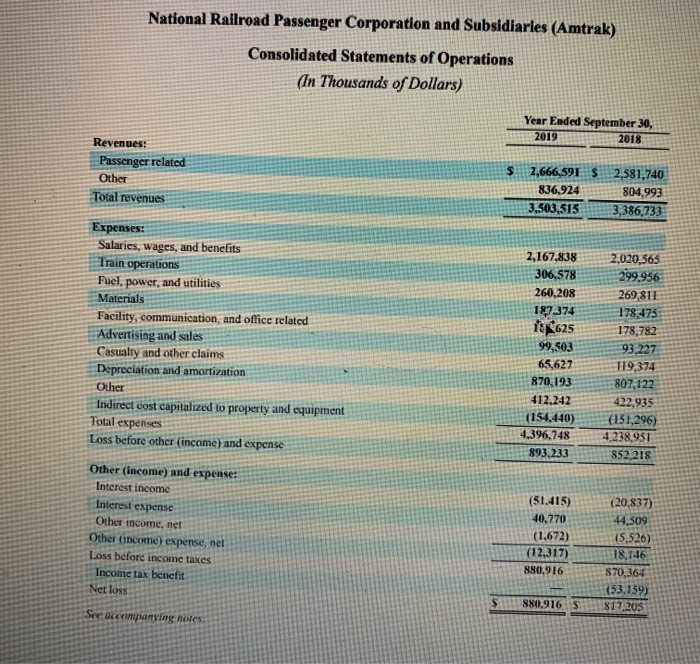
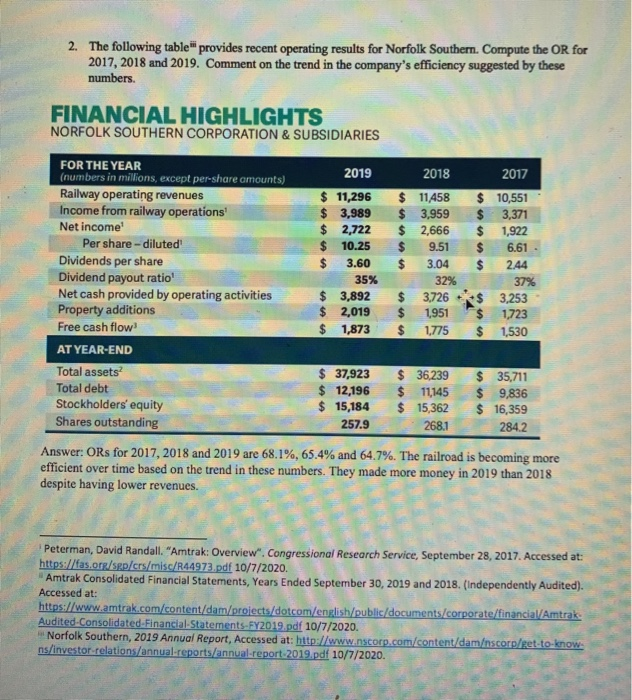
Rall efficiency analysis case study: 1. See the attached chart of operating results for Amtrak. Figure 2.Amtrak Ratio of Revenues to Expenses, 1995-2016 (total revenues/total expenses) 100% 95% 90% 85% 80% 75% 70% 65% 60% 55% 50% 9661 1997 2001 2000 1999 1995 1998 2004 2007 2009 2002 2003 2008 2005 2006 2010 2011 2012 2013 2014 2015 2016 Source: Calculated by CRS using data from Amtrak annual reports and financial statements. Notes: The spike around FY1998-FY1999 was due to a change in the way Amtrak accounted for federal and state grants. Without that change. Amtrak's ratio would have been 67% in FY 1998 and 68% in FY 1999. a C. Does this chart graph the operating ratio for Amtrak? Explain. b. Compute the 2018 and 2019 operating ratio for Amtrak based on the table below." Did Amtrak's efficiency improve or decline between 2018 and 2019? Explain. d. A search of the Amtrak annual report for the term "operating ratio" results in 0 hits. If this is such an important measure of operating performance that even the Indian National Railways track OR, why do you think Amtrak does not provide this information. e. What do you think should be done about Amtrak and its losses? National Railroad Passenger Corporation and Subsidiaries (Amtrak) Consolidated Statements of Operations (In Thousands of Dollars) Year Ended September 30, 2019 2018 Revenues: Passenger related Other Total revenues $ 2,666,591 $ 2,581,740 836,924 804,993 3,503,515 3,386,733 Expenses: Salaries, wages, and benefits Train operations Fuel, power, and utilities Materials Facility, communication, and office related Advertising and sales Casualty and other claims Depreciation and amortization Other Indirect cost capitalized to property and equipment Total expenses Loss before other (income) and expense 2,167,838 306,578 260,208 187.374 is 625 99,503 65,627 870,193 412.242 (154,440) 4.396,748 893.233 2,020,565 299,956 269,811 178,473 178,782 93,227 119,374 807,122 422,935 (151,296) 4.238,951 852.218 Other (income, and expense: Interest income Interest expense Other income, net Other (income) expense, net Loss before income taxes Income tax benefit Net loss (51.415) 40,770 (1.672) (12,317) 880,916 (20,837) 44.509 (5.526) 18,146 870,364 (53.159) 817.205 880.916 See accompanying notes 2. The following tablet provides recent operating results for Norfolk Southern Compute the OR for 2017, 2018 and 2019. Comment on the trend in the company's efficiency suggested by these numbers. FINANCIAL HIGHLIGHTS NORFOLK SOUTHERN CORPORATION & SUBSIDIARIES $ FOR THE YEAR 2019 (numbers in millions, except per-share amounts) 2018 2017 Railway operating revenues $ 11,296 $ 11458 $ 10,551 Income from railway operations' $ 3,989 $ 3,959 3,371 Net income $ 2,722 $ 2,666 1,922 Per share - diluted' $ 10.25 $ 9.51 $ 6.61 Dividends per share $ 3.60 3.04 $ 2.44 Dividend payout ratio' 35% 32% 37% Net cash provided by operating activities $ 3,892 $ 3,726 R$ 3,253 Property additions $ 2,019 1,951 1,723 Free cash flow $ 1,873 $ 1.775 $ 1,530 AT YEAR-END Total assets? $ 37,923 $ 36,239 $ 35,711 Total debt $ 12,196 $ 11,145 $ 9,836 Stockholders' equity $ 15,184 $ 15,362 $ 16,359 Shares outstanding 257.9 268.1 284.2 Answer: ORs for 2017, 2018 and 2019 are 68.1%, 65.4% and 64.7%. The railroad is becoming more efficient over time based on the trend in these numbers. They made more money in 2019 than 2018 despite having lower revenues. Peterman, David Randall. "Amtrak: Overview". Congressional Research Service, September 28, 2017. Accessed at: https://fas.org/sgp/crs/misc/R44973.pdf 10/7/2020. Amtrak Consolidated Financial Statements, Years Ended September 30, 2019 and 2018. (Independently Audited). Accessed at: https://www.amtrak.com/content/dam/projects/dotcom/english/public/documents/corporate/financial/Amtrak Audited-Consolidated-Financial Statements-FY2019.pdf 10/7/2020. Norfolk Southern, 2019 Annual Report, Accessed at: http://www.nscorp.com/content/dam corp/ret to know ns/Investor relations/annual reports/annual-report-2019.pdf 10/7/2020