

Ralph Henderson owns a cafe near MIT. His cafe is always crowded with students who need...
Fantastic news! We've Found the answer you've been seeking!
Question:


Transcribed Image Text:
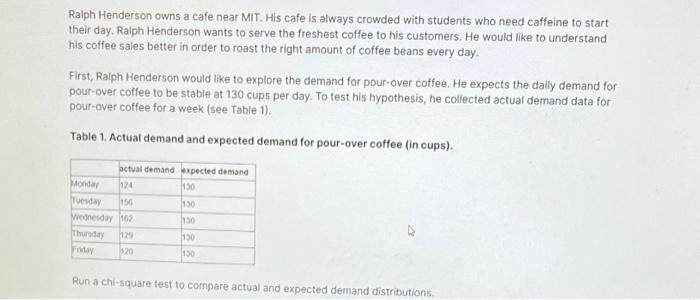
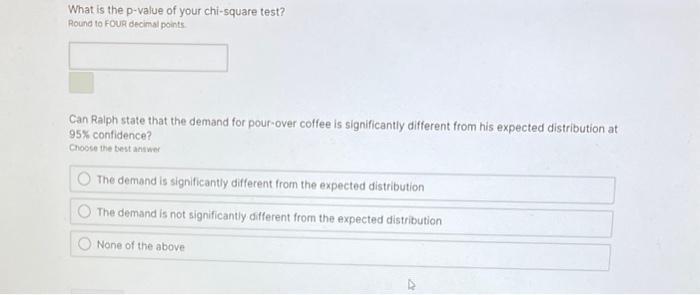
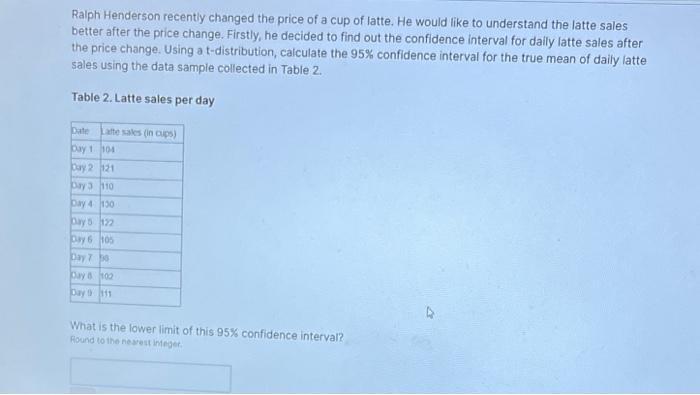
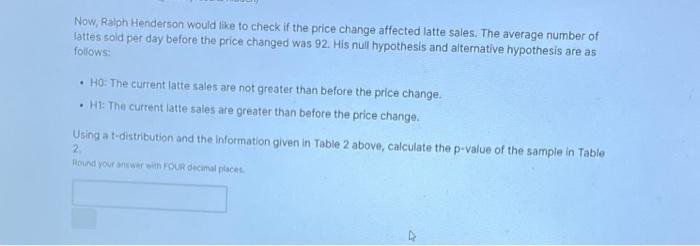
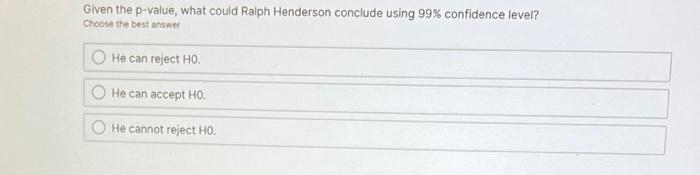
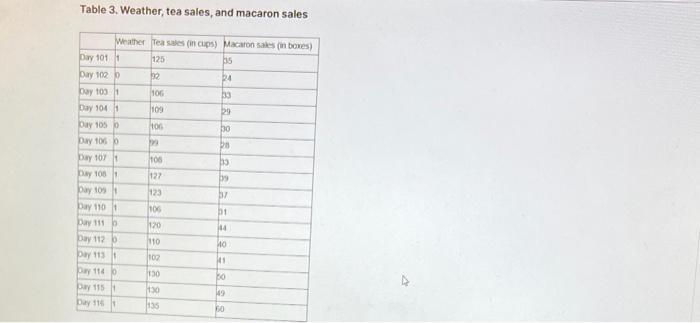
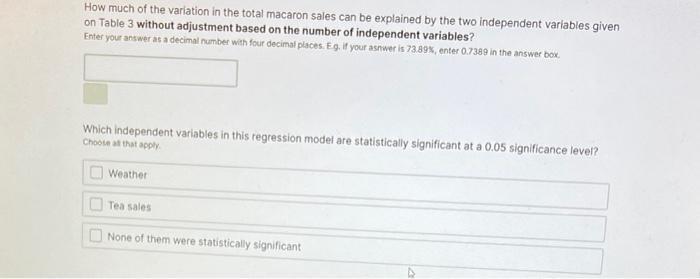
Ralph Henderson owns a cafe near MIT. His cafe is always crowded with students who need caffeine to start their day. Ralph Henderson wants to serve the freshest coffee to his customers. He would like to understand his coffee sales better in order to roast the right amount of coffee beans every day. First, Ralph Henderson would like to explore the demand for pour-over coffee. He expects the daily demand for pour-over coffee to be stable at 130 cups per day. To test his hypothesis, he collected actual demand data for pour-over coffee for a week (see Table 1). Table 1. Actual demand and expected demand for pour-over coffee (in cups). actual demand expected demand 130 130 130 Monday 124 Tuesday 156 Wednesday 162 Thursday 129 nday 120 130 130 Run a chi-square test to compare actual and expected demand distributions. What is the p-value of your chi-square test? Round to FOUR decimal points Can Ralph state that the demand for pour-over coffee is significantly different from his expected distribution at 95% confidence? Choose the best answer The demand is significantly different from the expected distribution The demand is not significantly different from the expected distribution None of the above Ralph Henderson recently changed the price of a cup of latte. He would like to understand the latte sales better after the price change. Firstly, he decided to find out the confidence interval for daily latte sales after the price change. Using a t-distribution, calculate the 95% confidence interval for the true mean of daily latte sales using the data sample collected in Table 2. Table 2. Latte sales per day Latte sales (in cups) Date Day 1 104 Day 2 121 Day 3 110 Day 4 130 Day 5 122 Day 6 105 Day 7 Day 8 102 Day 9 111 ho What is the lower limit of this 95% confidence interval? Round to the nearest integer. What is the upper limit of this 95% confidence interval? Round to the nearest integer. Now, Ralph Henderson would like to check if the price change affected latte sales. The average number of lattes sold per day before the price changed was 92. His null hypothesis and alternative hypothesis are as follows: •HO: The current latte sales are not greater than before the price change. .HT: The current latte sales are greater than before the price change. Using a t-distribution and the information given in Table 2 above, calculate the p-value of the sample in Table 2 Round your answer with FOUR decimal places. Given the p-value, what could Ralph Henderson conclude using 99% confidence level? Choose the best answer He can reject HO. He can accept HO. He cannot reject HO. Fifteen days ago, Ralph Henderson started selling macaron boxes in his coffee shop to offer customers something sweet to have with their preferred beverage. After careful observation, he believes that sales of macaron boxes may be influenced by tea sales and weather. He decided to build a linear regression model with "macaron boxes sales as the dependent variable, and "weather" and "tea sales" as independent variables. Use the data provided in Table 3 to build this linear regression model. Note that weather is coded in a way that 0 represents a rainy day and 1 represents a sunny day. Table 3. Weather, tea sales, and macaron sales Weather Tea sales (in cups) Macaron sales (in boxes) 125 35 24 33 29 30 28 Day 101 1 Day 102 Day 103 1 Day 104 1 Day 105 o Day 106 o Day 107 1 Day 108 1 bay 109 Day 110 1 Day 111 b Day 112 b Day 113 1 Day 114 o Day 115 1 Day 116 1 92 106 109 106 M 106 127 123 106 120 110 102 130 1:30 135 33 p9 37 b1 44 140 41 30 49 60 How much of the variation in the total macaron sales can be explained by the two independent variables given on Table 3 without adjustment based on the number of independent variables? Enter your answer as a decimal number with four decimal places. E.g. If your asnwer is 73.89%, enter 0.7389 in the answer box. Which independent variables in this regression model are statistically significant at a 0.05 significance level? Choose at that apply. Weather Tea sales None of them were statistically significant Ralph Henderson owns a cafe near MIT. His cafe is always crowded with students who need caffeine to start their day. Ralph Henderson wants to serve the freshest coffee to his customers. He would like to understand his coffee sales better in order to roast the right amount of coffee beans every day. First, Ralph Henderson would like to explore the demand for pour-over coffee. He expects the daily demand for pour-over coffee to be stable at 130 cups per day. To test his hypothesis, he collected actual demand data for pour-over coffee for a week (see Table 1). Table 1. Actual demand and expected demand for pour-over coffee (in cups). actual demand expected demand 130 130 130 Monday 124 Tuesday 156 Wednesday 162 Thursday 129 nday 120 130 130 Run a chi-square test to compare actual and expected demand distributions. What is the p-value of your chi-square test? Round to FOUR decimal points Can Ralph state that the demand for pour-over coffee is significantly different from his expected distribution at 95% confidence? Choose the best answer The demand is significantly different from the expected distribution The demand is not significantly different from the expected distribution None of the above Ralph Henderson recently changed the price of a cup of latte. He would like to understand the latte sales better after the price change. Firstly, he decided to find out the confidence interval for daily latte sales after the price change. Using a t-distribution, calculate the 95% confidence interval for the true mean of daily latte sales using the data sample collected in Table 2. Table 2. Latte sales per day Latte sales (in cups) Date Day 1 104 Day 2 121 Day 3 110 Day 4 130 Day 5 122 Day 6 105 Day 7 Day 8 102 Day 9 111 ho What is the lower limit of this 95% confidence interval? Round to the nearest integer. What is the upper limit of this 95% confidence interval? Round to the nearest integer. Now, Ralph Henderson would like to check if the price change affected latte sales. The average number of lattes sold per day before the price changed was 92. His null hypothesis and alternative hypothesis are as follows: •HO: The current latte sales are not greater than before the price change. .HT: The current latte sales are greater than before the price change. Using a t-distribution and the information given in Table 2 above, calculate the p-value of the sample in Table 2 Round your answer with FOUR decimal places. Given the p-value, what could Ralph Henderson conclude using 99% confidence level? Choose the best answer He can reject HO. He can accept HO. He cannot reject HO. Fifteen days ago, Ralph Henderson started selling macaron boxes in his coffee shop to offer customers something sweet to have with their preferred beverage. After careful observation, he believes that sales of macaron boxes may be influenced by tea sales and weather. He decided to build a linear regression model with "macaron boxes sales as the dependent variable, and "weather" and "tea sales" as independent variables. Use the data provided in Table 3 to build this linear regression model. Note that weather is coded in a way that 0 represents a rainy day and 1 represents a sunny day. Table 3. Weather, tea sales, and macaron sales Weather Tea sales (in cups) Macaron sales (in boxes) 125 35 24 33 29 30 28 Day 101 1 Day 102 Day 103 1 Day 104 1 Day 105 o Day 106 o Day 107 1 Day 108 1 bay 109 Day 110 1 Day 111 b Day 112 b Day 113 1 Day 114 o Day 115 1 Day 116 1 92 106 109 106 M 106 127 123 106 120 110 102 130 1:30 135 33 p9 37 b1 44 140 41 30 49 60 How much of the variation in the total macaron sales can be explained by the two independent variables given on Table 3 without adjustment based on the number of independent variables? Enter your answer as a decimal number with four decimal places. E.g. If your asnwer is 73.89%, enter 0.7389 in the answer box. Which independent variables in this regression model are statistically significant at a 0.05 significance level? Choose at that apply. Weather Tea sales None of them were statistically significant
Expert Answer:
Answer rating: 100% (QA)
The images provided ask for several statistical analyses including a chisquare test confidence inter... View the full answer

Related Book For 

Operations Management
ISBN: 978-0132687584
1st Canadian Edition
Authors: Jay Heizer, Barry Render, Paul Griffin
Posted Date:
Students also viewed these economics questions
-
In order to better serve their rural patients, Drs. Joe and Rick Parcells (brothers) began giving safety seminars. Especially popular were their emergency-preparedness talks given to farmers. Many...
-
To test his hypothesis that students who finish an exam first get better grades, a professor kept track of the order in which papers were handed in. Of the first 25 papers, 10 received a B or better...
-
The amount of caffeine (milligrams) in randomly sampled cups of coffee was as follows: a. Find the one-sided 99% confidence interval for the population mean caffeine content of a cup of coffee that...
-
Jack Hammer invests in a stock that will pay dividends of $2.00 at the end of the first year; $2.20 at the end of the second year; and $2.40 at the end of the third year. Also, he believes that at...
-
Sales by quarter for last year and the first three quarters of this year were as follows: Using a procedure that you develop that captures the change in demand from last year to this year and also...
-
What are the key factors that should be considered in determining whether a financial statement amount is "material"? Should auditors apply the same materiality guidelines or benchmarks as financial...
-
Three laser beams have wavelengths \(\lambda_{1}=400 \mathrm{~nm}, \lambda_{2}=\) \(600 \mathrm{~nm}\), and \(\lambda_{3}=800 \mathrm{~nm}\). The power of each laser beam is \(1 \mathrm{~W}\). a....
-
Jerry Bilderys factory is considering three approaches for meeting an expected increase in demand. These three approaches are increasing capacity, using overtime, and buying more equipment. Demand...
-
Explain and discuss the dynamic nature of capitalism in details
-
Merchant Company had the following foreign currency transactions: 1. On November 1, 20X6, Merchant sold goods to a company located in Munich, Germany. The receivable was to be settled in European...
-
Please be mindful that your paper will need an executive summary, equal to an average of 10% of your total paper word count. in your summary you will need to discuss your paper three sections (what...
-
What does Romer suggest as the appropriate role for governmental economic policy?
-
1.) Suppose an economy is initially in equilibrium when GDP equals $16 trillion. Now suppose government spending increases by $0.3 trillion and that the economy's multiplier is 3. What is the new...
-
Discuss whether a transnational capitalist class is really emerging, and, if so, what the implications are for business.
-
In the blackberry market, the quantity demanded is given by Q D = 2,600 1,000 P , and the quantity supplied is given by Q S = 100 + 500 P . What is the equilibrium price and equilibrium quantity?
-
During a particular week last spring, suppose that the price of a pound slab of wild King salmon at the local grocery store was $12.00; currently the price is $10.00. The manager informs you that...
-
Jennifer runs a gift store. Her sales last year were $280,000. Cost of goods sold were $170,000. Depreciation was $12,000. She paid interest of $6,500. At the beginning of the year, her longer term...
-
The following items were displayed in the statement of affairs for Lubbock Company: Fully secured liabilities ......... $90,000 Partially secured liabilities ....... 12,000 Unsecured liabilities...
-
Because of Creative Leisure has decided to increase manufacturing time available to produce the Mach 10. a) If demand remained the same but 300 minutes were available each day on the assembly line,...
-
What are the assumptions of break-even analysis?
-
Cynthia Knotts seafood restaurant buys fresh Nova Scotia lobster for $5 per pound and sells them for $9 per pound. Any oysters not sold that day are sold to her cousin, who has a nearby grocery...
-
Use Eqs. (7.27)-(7.31) to verify the entries in Table 7.1. Data from Eq. 7.27 Data from Eq. 7.28 Data from Eq. 7.29 Data from Eq. 7.30 Data from Eq. 7.31 Data from Table 7.1 n = 2 a.m = q- p.
-
Use the definition of the adjoint representation matrices (3.8), to compute the action of a generator \(X_{a}\) on a state \(\left|X_{b} ightangle\) given in Eq. (7.3). Data from Eq. 3.8 Data from...
-
Show that the operators given in Eq. (7.20) have the SU(2) commutators (7.21). Data from Eq. (7.20) Data from Eq. (7.21) Eta a. H E = E3 E = |a| a

Study smarter with the SolutionInn App