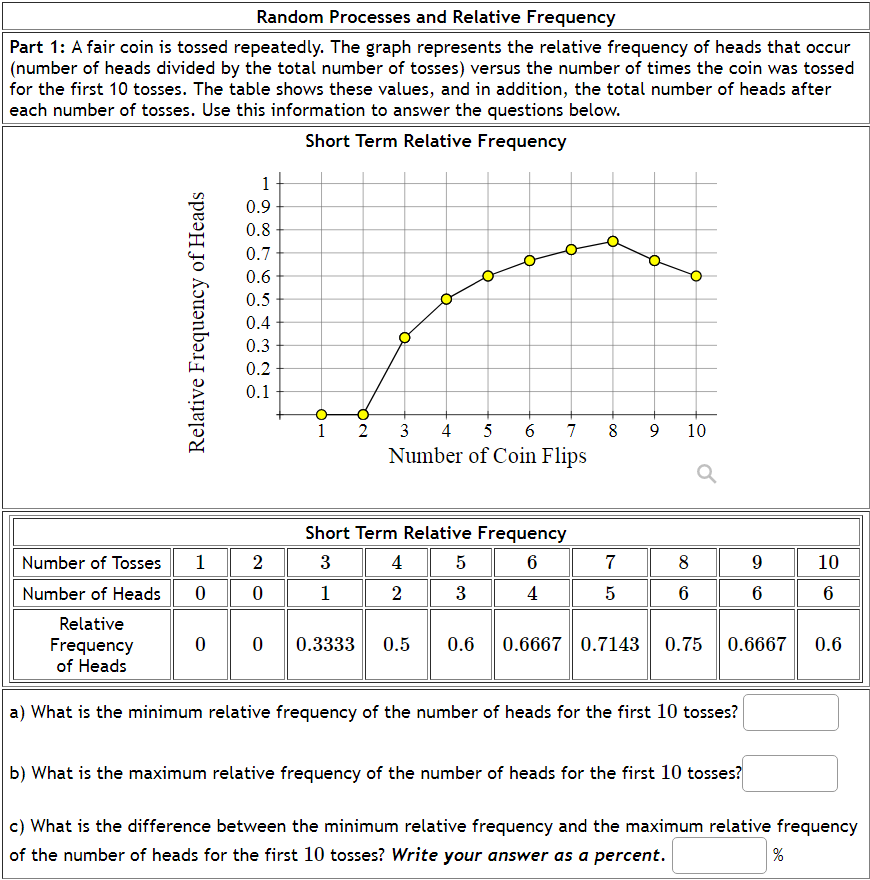
Question: Random Processes and Relative Frequency Part 1: A fair coin is tossed repeatedly. The graph represents the relative frequency of heads that occur {number of

Random Processes and Relative Frequency Part 1: ARandom Processes and Relative Frequency Part 1: ARandom Processes and Relative Frequency Part 1: ARandom Processes and Relative Frequency Part 1: ARandom Processes and Relative Frequency Part 1: A
Random Processes and Relative Frequency Part 1: A fair coin is tossed repeatedly. The graph represents the relative frequency of heads that occur {number of heads divided by the total number of tosses] versus the number of times the coin was tossed for the first 10 tosses. The table shows these values, and in addition, the total number of heads after each number of tosses. Use this information to answer the questions below. Short Term Relative Frequency Relative Frequency of Heads Short Term Relative Frequency Number of Tosses 1 2 3 4 Number of Heads 0 U 1 2 Relative Frequency 0 . 0.5 . 0. 6667 0. 7143 l]. 75 0. 6667 of Heads a} What is the minimum relative frequency of the number of heads for the first 10 tosses?:] b) What is the maximum relative frequency of the number of heads for the first 10 tosses?:] c) What is the difference between the minimum relative frequency and the maximum relative frequency of the number of heads for the first ll] tosses? Write your answer as a percent. C] % Part 2: The graph below represents the relative frequency of heads that occur (number of heads divided by the total number of tosses) versus the number of times the coin was tossed for the first 1000 tosses. The table shows these values, and in addition, the total number of heads for the 991st to 1000th tosses. Use this information to answer the questions below. Long Term Relative Frequency 0. 0.8 0.7 0. Relative Frequency of Heads 100 200 300 400 500 600 700 800 900 1000 Number of Coin Flips Q Long Term Relative Frequency Number of 991 992 993 994 995 996 997 998 999 1000 Tosses Number of 523 524 524 525 526 527 527 528 529 530 Heads Relative Frequency 0.5277 0.5282 0.5277 0.5282 0.5286 0.5291 0.5286 0.5291 0.5295 0.53 of Heads a) What is the minimum relative frequency of the number of heads for the tosses between 991 and 1000 b) What is the maximum relative frequency of the number of heads for the tosses between 991 and 1000? c) What is the difference between the minimum relative frequency and the maximum relative frequency of the number of heads for for the tosses between 991 and 1000? Write your answer as a percent. d) Since the coin is fair, on average, approximately half of the tosses should be heads. So when the coin is tossed 1000 times approximately 500 of the tosses should be heads. What is the actual number of heads for 1000 tosses as given by the chart? e) What is the difference between the number of heads we should expect on average, 500, and the actual number of heads for 1000 tosses? f) What is the difference between the percent we expect to be heads on average, 50% , and the relative frequency as a percent from the table for 1000 tosses?The table below shows the number of survey subjects who have received and not received a speeding ticket in the last year, and the color of their cars. Speeding Ticket No Speeding Ticket Total Red Car 180 116 296 Not Red Car 150 122 272 Total 330 238 568 Find the probability that a randomly chosen person: a) Has a red car. b) Does not have a red car. c) Has received a speeding ticket. d) Has not recieved a speeding ticket. e) Has a red car and got a speeding ticket. Write your answers in decimal form, rounded to the nearest thousandth.Giving a test to a group of students, the grades and gender are summarized below A B C Total Male 5 16 2 23 Female 10 11 17 38 Total 15 27 19 61 If one student was chosen at random, determine the following probabilities. Write your answers as reduced fractions. P(Student was male) = P(Student got an A) = P(Student was male and got an "A") = P(Student was female and got a "B") = P(Student did not get an "A") =The Venn diagram below shows the number cars in a parking garage. Red Ford 13 6 4 10 A car is chosen at random. Determine the probability that this car a) Is red. b) Is a Ford. c) Is not a Ford. d) Is a red Ford. e) Is not red. Write your answers as reduced fractions

Step by Step Solution

There are 3 Steps involved in it

1 Expert Approved Answer
Step: 1 Unlock blur-text-image
Question Has Been Solved by an Expert!

Get step-by-step solutions from verified subject matter experts

Step: 2 Unlock
Step: 3 Unlock

Students Have Also Explored These Related Mathematics Questions!