

Question: Range Pessimistic Optimistic Initial investment Revenues Variable costs Fixed cost + 50% - 25% -15% + 25% + 25% - 15 % + 25%
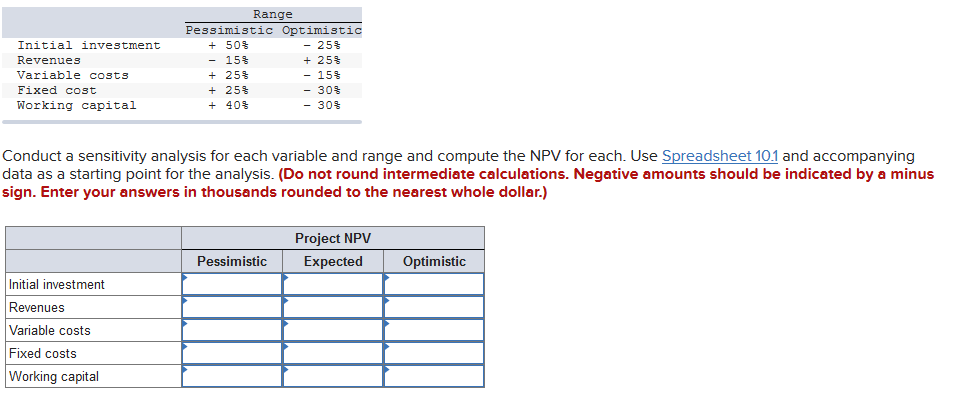
Range Pessimistic Optimistic Initial investment Revenues Variable costs Fixed cost + 50% - 25% -15% + 25% + 25% - 15 % + 25% - 30% Working capital + 40% - 30% Conduct a sensitivity analysis for each variable and range and compute the NPV for each. Use Spreadsheet 10.1 and accompanying data as a starting point for the analysis. (Do not round intermediate calculations. Negative amounts should be indicated by a minus sign. Enter your answers in thousands rounded to the nearest whole dollar.) Pessimistic Project NPV Expected Optimistic Initial investment Revenues Variable costs Fixed costs Working capital
Step by Step Solution
There are 3 Steps involved in it

Get step-by-step solutions from verified subject matter experts