

Question: Rate law. 1. Record data for the experiment on the data table and fill in the calculated values. Table 1. Data for time and temperature.
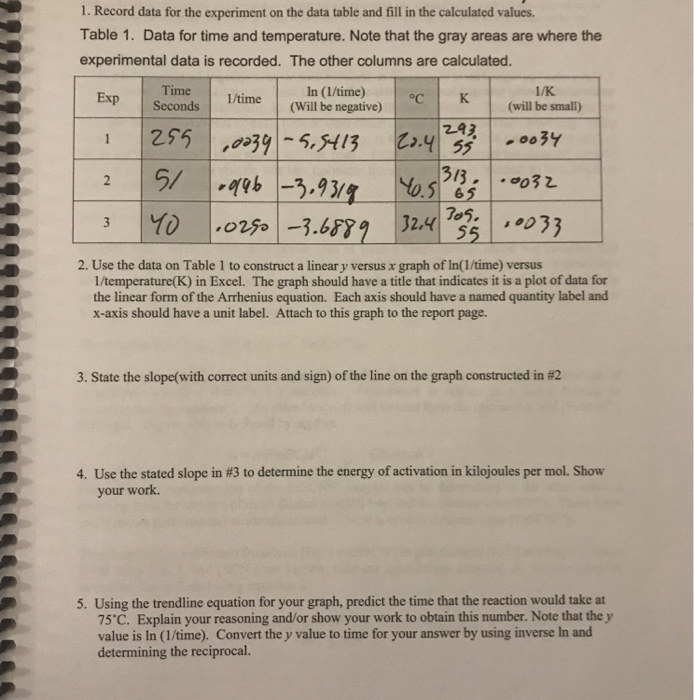
1. Record data for the experiment on the data table and fill in the calculated values. Table 1. Data for time and temperature. Note that the gray areas are where the experimental data is recorded. The other columns are calculated. Time Seconds /timeIn (1/time) 1/K Ttime Will be negative) K(will be small) C | 293 313 . 2. Use the data on Table 1 to construct a linear y versus x graph of In(1/time) versus 1/temperature(K) in Excel. The graph should have a title that indicates it is a plot of data for the linear form of the Arrhenius equation. Each axis should have a named quantity label and x-axis should have a unit label. Attach to this graph to the report page 3, State the slope(with correct units and sign) of the line on the graph constructed in #2 4, Use the stated slope in #3 to determine the energy of activation in kilojoules per mol. Show your work. 5. Using the trendline equation for your graph, predict the time that the reaction would take at 75'C. Explain your reasoning and/or show your work to obtain this number. Note that the y value is In (1/time). Convert the y value to time for your answer by using inverse In and determining the reciprocal
Step by Step Solution
There are 3 Steps involved in it

Get step-by-step solutions from verified subject matter experts