

Question: Ratio Analysis 2014 2015 2016E Industry Average Current 2.3 1.5 2.7 Quick 0.8 0.5 1.0 Inventory turnover 4.0 4.0 6.1 Days sales outstanding 37.4 days
| Ratio Analysis | 2014 | 2015 | 2016E | Industry Average |
|---|---|---|---|---|
| Current | 2.3 | 1.5 | 2.7 | |
| Quick | 0.8 | 0.5 | 1.0 | |
| Inventory turnover | 4.0 | 4.0 | 6.1 | |
| Days sales outstanding | 37.4 days | 39.6 days | 32.0 days | |
| Fixed assets turnover | 10.0 | 6.2 | 7.0 | |
| Total assets turnover | 2.3 | 2.0 | 2.5 | |
| Debt ratio | 35.6% | 59.6% | 32.0% | |
| TIE | 3.3 | 0.1 | 6.2 | |
| EBITDA coverage | 2.6 | 0.8 | 8.0 | |
| Profit margin | 2.6% | 1.6% | 3.6% | |
| Basic earning power | 14.2% | 0.6% | 17.8% | |
| ROA | 6.0% | 3.3% | 9.0% | |
| ROE | 13.3% | 17.1% | 17.9% | |
| Price/earnings (P/E) | 9.7 | N.M. | 16.2 | |
| Price/cash flow | 8.0 | 27.5 | 7.6 | |
| Market/book | 1.3 | 1.1 | 2.9 |
-
Calculate the 2016 price/earnings ratio, price/cash flow ratio, and market/book ratio. Do these ratios indicate that investors are expected to have a high or low opinion of the company?
-
Perform a common size analysis and percent change analysis. What do these analyses tell you about Computron?
-
Use the extended DuPont equation to provide a summary and overview of Computron's financial condition as projected for 2016. What are the firm's major strengths and weaknesses?
-
What are some potential problems and limitations of financial ratio analysis?
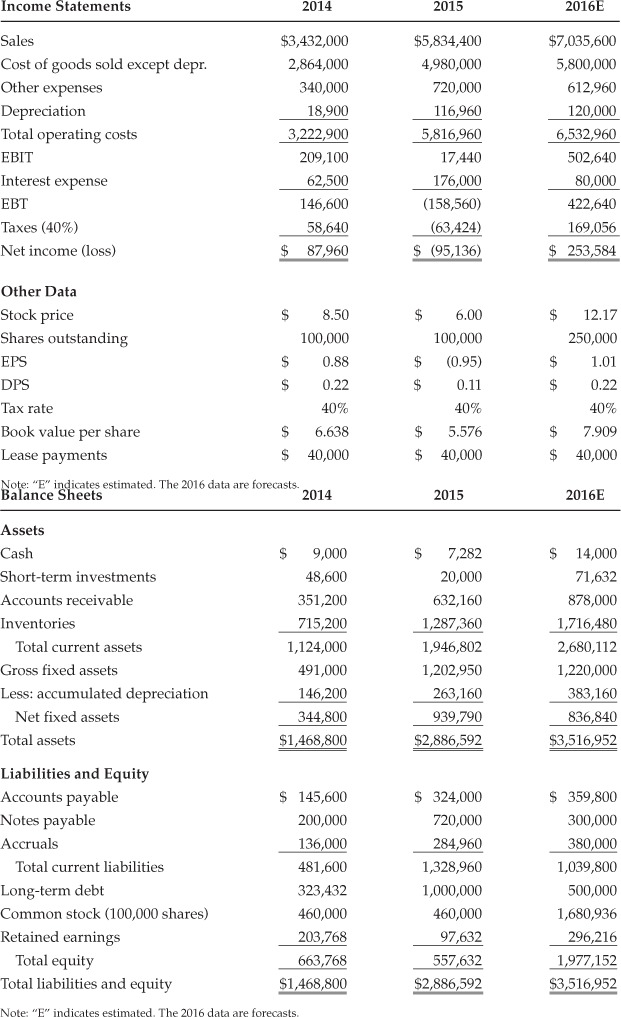
Income Statements 2014 2015 2016E Sales Cost of goods sold except depr. Other expenses Depreciation Total operating costs EBIT Interest expense Taxes (40%) Net income (loss) $3,432,000 2,864,000 340,000 18,900 3,222,900 209,100 62,500 146,600 58,640 $ 87,960 $5,834,400 4,980,000 720,000 116,960 5,816,960 17,440 176,000 (158,560) (63,424) $ (95,136) $7,035,600 5,800,000 612,960 120.000 6,532,960 502,640 80,000 422,640 169,056 $ 253,584 $ 6.00 $ 100,000 12.17 250,000 1.01 0.22 $ (0.95) $ $ DPS $ 0.11 Other Data Stock price $ 8.50 Shares outstanding 100,000 EPS $ 0.88 S 0.22 Tax rate 40% Book value per share S 6.638 Lease payments S 40,000 Note: "E" indicates estimated. The 2016 data are forecasts. Balance Sheets 2014 40% 5.576 40% 7.909 $ $ $ 40,000 $ 40,000 2015 2016E Assets Cash Short-term investments Accounts receivable Inventories Total current assets Gross fixed assets Less: accumulated depreciation Net fixed assets Total assets S 9,000 48,600 351,200 715,200 1,124,000 491,000 146,200 344,800 $1,468,800 S 7,282 20,000 632,160 1,287,360 1,946,802 1,202,950 263,160 939,790 $2,886,592 $ 14,000 71,632 878,000 1,716,480 2,680,112 1,220,000 383,160 836,840 $3,516,952 Liabilities and Equity Accounts payable Notes payable Accruals Total current liabilities Long-term debt Common stock (100,000 shares) Retained earnings Total equity Total liabilities and equity $ 145,600 200,000 136,000 481,600 323,432 460,000 203,768 663,768 $1,468,800 $ 324,000 720,000 284,960 1,328,960 1,000,000 460,000 97,632 557,632 $2,886,592 $ 359,800 300,000 380,000 1,039,800 500,000 1,680,936 296,216 1,977,152 $3,516,952 Note: "E" indicates estimated. The 2016 data are forecasts Income Statements 2014 2015 2016E Sales Cost of goods sold except depr. Other expenses Depreciation Total operating costs EBIT Interest expense Taxes (40%) Net income (loss) $3,432,000 2,864,000 340,000 18,900 3,222,900 209,100 62,500 146,600 58,640 $ 87,960 $5,834,400 4,980,000 720,000 116,960 5,816,960 17,440 176,000 (158,560) (63,424) $ (95,136) $7,035,600 5,800,000 612,960 120.000 6,532,960 502,640 80,000 422,640 169,056 $ 253,584 $ 6.00 $ 100,000 12.17 250,000 1.01 0.22 $ (0.95) $ $ DPS $ 0.11 Other Data Stock price $ 8.50 Shares outstanding 100,000 EPS $ 0.88 S 0.22 Tax rate 40% Book value per share S 6.638 Lease payments S 40,000 Note: "E" indicates estimated. The 2016 data are forecasts. Balance Sheets 2014 40% 5.576 40% 7.909 $ $ $ 40,000 $ 40,000 2015 2016E Assets Cash Short-term investments Accounts receivable Inventories Total current assets Gross fixed assets Less: accumulated depreciation Net fixed assets Total assets S 9,000 48,600 351,200 715,200 1,124,000 491,000 146,200 344,800 $1,468,800 S 7,282 20,000 632,160 1,287,360 1,946,802 1,202,950 263,160 939,790 $2,886,592 $ 14,000 71,632 878,000 1,716,480 2,680,112 1,220,000 383,160 836,840 $3,516,952 Liabilities and Equity Accounts payable Notes payable Accruals Total current liabilities Long-term debt Common stock (100,000 shares) Retained earnings Total equity Total liabilities and equity $ 145,600 200,000 136,000 481,600 323,432 460,000 203,768 663,768 $1,468,800 $ 324,000 720,000 284,960 1,328,960 1,000,000 460,000 97,632 557,632 $2,886,592 $ 359,800 300,000 380,000 1,039,800 500,000 1,680,936 296,216 1,977,152 $3,516,952 Note: "E" indicates estimated. The 2016 data are forecasts
Step by Step Solution
There are 3 Steps involved in it

Get step-by-step solutions from verified subject matter experts