

Question: RATIO ANALYSIS Data for Barry Computer Co. and its industry averages follow. a. Calculate the indicated ratios for Barry c. Outline Barry's strengths and weaknesses
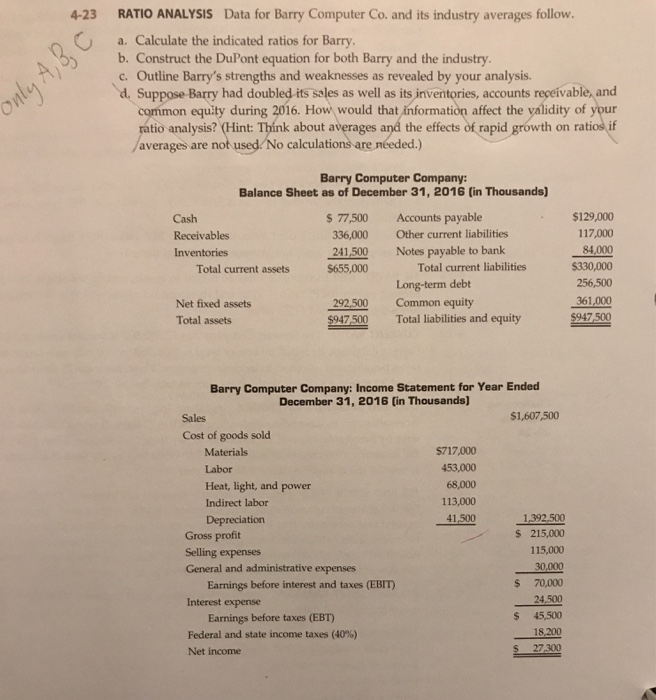
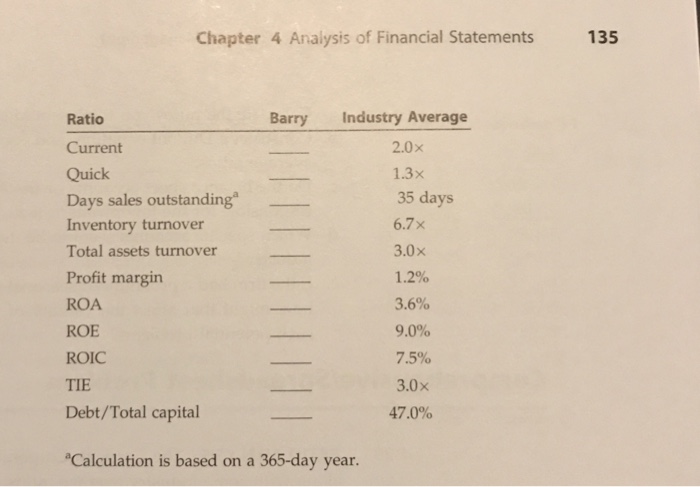
RATIO ANALYSIS Data for Barry Computer Co. and its industry averages follow. a. Calculate the indicated ratios for Barry c. Outline Barry's strengths and weaknesses as revealed by your analysis. 4-23 b. Construct the DuPont equation for both Barry and the industry d. Suppose Barry had doubled its sales as well as its inventories, accounts receivable,and common equity during 2016. How would that information affect the yalidity of your ratio analysis? (Hint: Think about averages and the effects of rapid growth on ratiosif /averages are not used No calculations are neded.) Barry Computer Company: Balance Sheet as of December 31, 2016 (in Thousands) $129,000 117,000 84,000 $330,000 256,500 361,000 $947 500 Total liabilities and equity 947500 $77,500 Accounts payable Cash Receivables Inventories 336,000 Other current liabilities 241,500 Notes payable to bank $655,000 Total current assets Total current liabilities Long-term debt 292.500 Common equity Net fixed assets Total assets Barry Computer Company: Income Statement for Year Ended December 31, 2016 (in Thousands) Sales $1,607,500 Cost of goods sold Materials Labor Heat, light, and power Indirect labor Depreciation $717,000 453,000 68,000 113,000 41,.5001392.500 Gross proft Selling expenses General and administrative expenses S 215,000 115,000 $ 70,000 24,500 $ 45,500 18,200 $ 27.300 Earnings before interest and taxes (EBIT Interest expense Earnings before taxes (EBT Federal and state income taxes (40%) Net income
Step by Step Solution
There are 3 Steps involved in it

Get step-by-step solutions from verified subject matter experts